Software
To support the analysis of DNA and chromosomal alterations, we develop algorithms and computational procedures for the detection of mobile DNA elements from reference genomes and high-throughput sequencing. Some of our softwares for data analysis and visualization are already available.

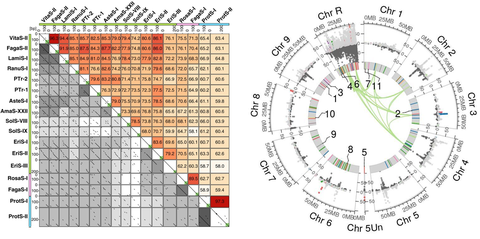
This exemplarily shows how we analyze and display sequence data. Left: Visualization of sequence similarities by a compilation of 153 dotplots with our FlexiDot software. Right: Comparative presentation of two high-throughput sequencing datasets along the reference genome of the sugar beet by our software ECCsplorer.
ECCsplorer pipeline
The ECCsplorer pipeline (https://github.com/crimBubble/ECCsplorer) implemented in Python is used for the detection of extrachromosomal circular DNA (eccDNA) in any organism from next-generation sequencing data. EccDNAs are circular DNAs physically separated from the chromosomes and range in size from 100 bp to several megabases. They are found in all eukaryotes and are often associated with repetitive elements such as rDNA or LTR retrotransposons. The ECCsplorer is a bioinformatics pipeline that automatically analyzes so-called circSeq or mobilome-Seq data (experimental amplification of circular DNA followed by Illumina sequencing) and captures eccDNA candidates. The ECCsplorer is modular and includes both a reference genome-guided and a reference genome-free approach for detection, allowing it to be used for theoretically any organism and for answering a large number of different biological questions.
Key features:
- Modular approach for a wide range of applications (reference genome-guided, reference genome-free, and comparative)
- Use of raw data possible (quality assurance module included)
- Improves reproducibility and comparability of circSeq/mobilome-Seq studies
The ECCsplorer pipeline is described and applied in the following article:
Mann L., Seibt K. M., Weber B., Heitkam T. (2022): “ECCsplorer: a pipeline to detect extrachromosomal circular DNA (eccDNA) from next-generation sequencing data”, BMC Bioinformatics 23:40, doi: 10.1186/s12859-021-04545-2
SINE-finder
The SINE-finder identification tool, implemented in Python, established the foundation for short interspersed nuclear element (SINE) identification in many plant genomes, among them:
- potato and other Solanaceae (in original SINE-finder publication and here)
- Poaceae (read resulting paper)
- Amaranthaceae (read resulting paper)
Identification is prerequisite for SINE application in the Inter-SINE amplification polymorphism (ISAP) protocol, as introduced by Seibt et al. (2012) and described step-by-step by Wenke et al. (2015). Our partners have also applied and published ISAP protocols here and here.
The SINE-finder software can be found with the article describing it:
Wenke T., Döbel T., Rosleff Sörensen T., Junghans H., Weisshaar B. and Schmidt T. (2011): Targeted identification of Short Interspersed Nuclear Element families shows their wide-spread existence and extreme heterogeneity in plant genomes. The Plant Cell 23(9):3117-28 read article
FlexiDot

FlexiDot logo
FlexiDot is a cross-platform dotplot suite generating high quality self, pairwise and all-against-all visualizations. To improve dotplot suitability for comparison of consensus and error-prone sequences, FlexiDot harbors routines for strict and relaxed handling of mismatches and ambiguous residues. The custom shading modules facilitate dotplot interpretation and motif identification by adding information on sequence annotations and sequence similarities to the images. Combined with collage-like outputs, FlexiDot supports simultaneous visual screening of a large sequence sets, allowing dotplot use for routine screening.
Some features are:
- high flexibility for customization and automation
- self, pairwise and all-against-all visualizations
- similarity shading modes
- output as vector and raster graphics
- handling of error-prone SMRT reads and ambiguity-containing consensus sequences (e.g. derived by alignment or assembly).
- integration of descriptive information on the analyzed sequences (e.g. gff3-type structural sequence annotation or pairwise identities)
See for example this tutorial on adding gff3-type annotation to a dotplot.
More:
- Download, examples and documentation at our github page
- Seibt K. M., Schmidt T. and Heitkam T. (2018): FlexiDot: Highly customizable, ambiguity-aware dotplots for visual sequence analyses. Bioinformatics doi: 10.1093/bioinformatics/bty395 read article (this link grants pdf access)

