
Sep 18, 2026
Research in Progress: Where should green hydrogen energy parks go in Germany?
Where in Germany can green hydrogen actually be produced sustainably? On paper, the answer looks straightforward: pick counties with strong wind or solar resources, build the electrolysers next to them, and connect them to the grid. The question of suitable locations for green hydrogen production is already explored within the Boysen-TUD-GRK from a different perspective, focusing on the MENA region The GRK reported. While that research focused in particular on spatial suitability and the most favourable conditions for production, this project turns to Germany with a different emphasis: how can ecological, social, economic and feasibility aspects be considered together when identifying suitable locations? In practice, sustainability adds a layer of complexity that resource maps alone don't capture. Renewable energy parks can still damage biodiversity, compete with agriculture for land and water, and meet local resistance - and once cost enters the picture, the location that looks best on paper is rarely the cheapest one to build. RTG doctoral students Varun-Bharadwaj Gurugubelli, Marie Walstab, Sampath Weerappulli, and Inês Almeida, together with former doctoral student Christian Gutsche, are trying to answer a harder version of the siting question: The joint research project is part of Cluster F and is conducted by the participating researchers alongside their individual PhD projects. Their aim is not only to determine where the resources are available, but where a green hydrogen energy park can be built without compromising the very sustainability it is intended to provide.
Not just a resource map
Germany's National Hydrogen Strategy expects green hydrogen and its downstream products to become central to decarbonising hard-to-abate sectors like industry and transport, with domestic demand estimated at 95 to 130 TWh by 2030. Meeting part of that demand locally means expanding renewable capacity and electrolyser installations, often built together as energy parks that combine solar or wind generation with electrolysers on site. A literature search turned up plenty of studies on siting electrolysers, and plenty on siting renewable energy parks - but, according to the literature reviewed by the team, no study that combines the two for Germany from a sustainability perspective rather than a purely technical or economic one.That gap matters because the two perspectives don't always agree. Domestic green hydrogen production is currently barely competitive on cost, which pulls site selection toward the cheapest available land. Sustainability pulls in a different direction, toward counties where renewable projects won't come at the expense of biodiversity, water, or the people living nearby. The researchers therefore face a problem that is not simply about finding the “best” location: they first have to decide how sustainability should be defined, measured, and protected when different interests conflict. The project's central bet is that this tension isn't a footnote to be waved away, but the actual problem to be solved.
Turning sustainability into a number
Turning that idea into something usable meant answering an unglamorous but essential question first: what, exactly, counts as "sustainable" for a hydrogen energy park, and how do you compare it across all of Germany's roughly 400 counties on equal terms? The team's answer was a two-step decision framework built around a set of indicators drawn from the wind, solar, and hydrogen siting literature, grouped into four categories: ecological, social, economic, and feasibility (see Fig.1).
The challenge is therefore to turn a broad idea such as sustainability into a set of criteria that can actually be compared across hundreds of different places.
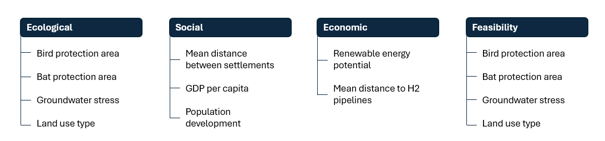
Fig. 1: Sustainability indicators used to compare counties, grouped by category.
The first step is a hard filter. Counties are screened against the feasibility indicators - protected areas, minimum distances to settlements - and a county that fails badly enough on even one of these is excluded outright, however well it might score everywhere else (see Fig.2). Counties that pass are then scored and ranked across the remaining indicators. This is where the methodology tries to do something different from most comparable studies: instead of weighting indicators by expert judgement or stakeholder pressure, the weights are tied to how close Germany already is to breaching the corresponding planetary boundary or social threshold. A criterion linked to an already-overshot limit counts for more than one where Germany still has headroom, even if the county-level differences on that second criterion look larger on a map. In other words, the team is trying to prevent a strong economic or technical score from simply compensating for a serious ecological problem. Sustainability is built into the ranking's arithmetic itself, rather than applied as a judgement call afterwards.
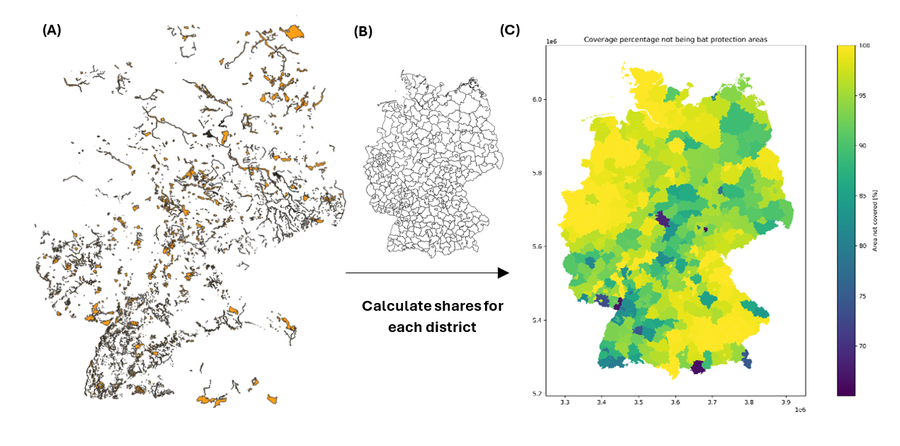
Fig. 2: (A) Bat protection area shapefile, (B) Map of Germany segregated into counties, (C) Coverage percentage not being bat protection areas.
When the plan met the data
Defining the framework was only one part of the challenge. Once the concept had to be applied to 400 counties, a second problem emerged: the data itself. Much of what has actually taken time in this project isn't the sustainability concept itself, but the practical business of getting 400 counties' worth of geographic data to talk to each other. Identifying suitable areas means combining county boundaries with settlement areas and several overlapping environmental and nature-protection layers, all of which have to be processed carefully so the same patch of land isn't excluded twice. The team started in QGIS, but as the datasets grew, routine operations - combining exclusion layers, fixing broken geometries, calculating the remaining suitable area for every county - began to take longer than the analysis itself. Moving much of the workflow into Python turned out to be the real fix: it let the team process the data faster, automate the repetitive parts, and rerun the whole pipeline consistently whenever an assumption or a data source changed.
Some of the resulting choices were less about elegance than necessity. Geographic information can be stored as vector data - points, lines, and shapes that map specific features like a settlement or a road - or as raster data, a grid of cells more like a digital photo. Raster data captures more nuance but is far more demanding to process at national scale, so wherever possible the team used vector data instead, trading a little precision for something they could actually run 400 times over without it grinding to a halt. The same logic pushed the whole analysis down to the county level: fine enough to be meaningful, coarse enough to stay practical, and for some indicators, the only resolution the data exists at in the first place. Water stress in Germany turned out to be one of them - no public dataset reports it at county level. The environmental group BUND had already calculated it from open groundwater and water-use data, but published the results only as a map, without the underlying numerical data, so the team rebuilt BUND’s method from scratch to get usable figures on their own.
Not every surprise was technical. Looking into how legal siting restrictions might factor into the analysis, the team expected a thicket of binding distance rules between energy infrastructure and settlements. What they found was closer to the opposite: aside from one 200m buffer that traces back to an actual court ruling, most of the commonly cited minimum-distance rules turn out to be non-binding planning guidance rather than law - guidance that can shift with the next policy decision, not fixed ground truth to design around. That's part of why legal restrictions, beyond the 200m buffer, were deliberately left out of the current assessment.
Where the project stands
With the indicators and the weighting logic defined, the team is now working through the data, indicator by indicator. Several are complete; others, along with the aggregation step that will combine them into one ranked hierarchy of counties, are still in progress. The first analyses already show why the final ranking is not straightforward: ecological, social, and economic indicators point toward different regions of Germany. Because these interim results haven't been validated yet, the team isn't publishing county-level findings at this stage - those will follow once the full ranking is ready to stand on its own.
Can sustainable beat cheap?
This brings the research back to the question that motivated it in the first place. Once the ranking exists, will a more sustainable county actually be chosen over a cheaper one? Domestic hydrogen production is currently barely cost-competitive, and the team is still working out how to make a sustainability-first recommendation persuasive in practice, not just defensible on paper. A related question neither the ranking nor the literature has settled is whether renewable generation and hydrogen production even need to sit at the same site at all, or whether spatial separation could open up better options on both fronts. Those are the questions the next phase is built around: finishing the remaining indicators, then defining the indifference and veto thresholds that convert planetary-boundary and social-threshold performance into concrete weights, before producing a single ranked hierarchy of counties.
Beyond hydrogen specifically, the appeal of the approach is that it refuses to let a good economic case simply outvote a bad ecological one. If the final ranking holds up, it could provide a basis for future site-selection decisions under the National Hydrogen Strategy – not by replacing the cost question, but by making sure sustainability has to be addressed on its own terms first.