Feb 12, 2021; Course of talks
DataVis Help DeskDataVis Help Desk: Tidy up! – Tips for decluttering your diagrams
Meeting ID: 858 4331 4580
Passcode: Boxpl0t!
Your charts have more text than data points? Which gridlines and tick marks can you remove? Your legends are more visible than your research? We’ll discuss 10 tricks to tidy up your diagrams and charts.
The spring term of the DataVis Help Desk resumes in February and March. On February 12th, we’ll start the year by cleaning up – not your house, but charts! On February 26th, we move on to a special visualization, the clinical trial schematic or diagram, and discuss how to make easy-to-read plans that require little space. On March 12th, we’ll cover tables, a classic visualization, and review typography and alignment to create tidy tables. On March 26th, we look into layouting figures for grants – ways to save space and use up the entire width of a line.
PS You have a sad plot that you want to make better? Send it in and we’ll discuss improving it together! helena.jambor@tu-dresden.de
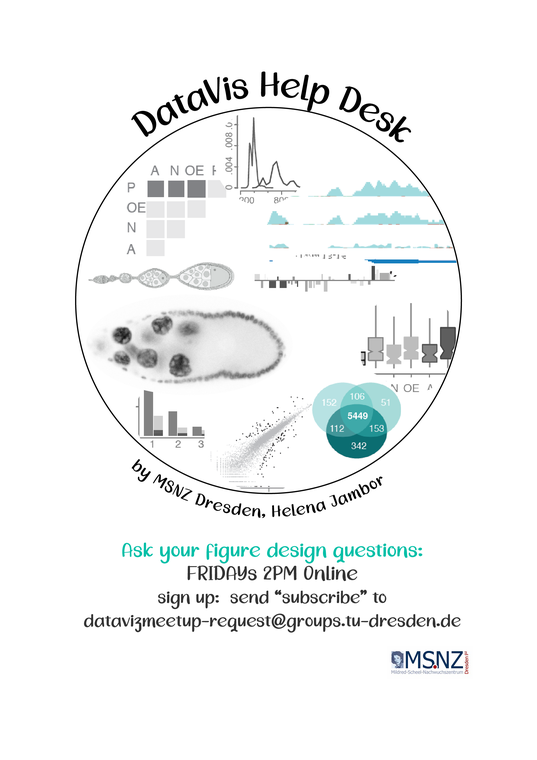
Subscribe to the mailing list regular updates about seminars. Send Email with the text "subscribe" to datavizmeetup-request@groups.tu-dresden.de or to Helena.jambor@tu-dresden.de.