Alumni der Umweltfernerkundungsgruppe
Alumni Mailingliste
Du bist ein Alumni oder ehemalige/r Mitarbeiter/in der Umweltfernerkundungsgruppe? Dann trage dich in unsere Alumni Mailingliste ein! Die Mailingliste wird genutzt, um öffentliche Veranstaltungen und wichtige Neuigkeiten der Umweltfernerkundungsgruppe bekannt zu geben und um dir interne oder externe Stellenausschreibungen weiterzuleiten.
Alumni
Entwicklung eines Schlüssels zur Bestimmung von Brandlastmodellen nach Scott & Burgan zur Anwendung in Sachsen
Studiengang
Bachelor Forstwissenschaften
Verteidigungsdatum
28.03.2025
Betreuer
Matthias Forkel, Clemens Holzweißig
Zusammenfassung
Ziel der Arbeit war die Erstellung eines Schlüssels zur Bestimmung der Brandlastmodelle nach Scott und Burgan (2005) im Gelände unter sächsischen Verhältnissen.
Bei einer ersten Überprüfung der Anwendbarkeit im Gelände wurden relevante und vor Ort feststellbare Unterscheidungsmerkmale bestimmt. Die grobe Einteilung der Modelle nach Hauptbrennmaterialien wurde von Scott und Burgan (2005) übernommen. Die Lokalisierung erfolgte durch die Übertragung der dynamischen forstlichen Klimastufen des Freistaates Sachsen auf die klimatischen Einteilung der Brandlastmodelle durch Scott und Burgan (2005). Der Schlüssel wurde schriftlich in Zeilenform erarbeitet, soll aber auch zur digitalen Anwendung zur Verfügung gestellt werden. Das Bestimmungsergebnis ist immer ein konkretes Brandlastmodell. Dieses sollte aber kritisch hinterfragt werden, da im Bestimmungsgang viele Bestimmungsmerkmale subjektiv unterschieden werden.
Es sind einige Beispielanwendungen des Schlüssels aufgeführt, aber dokumentierte
Feldversuche wurden noch nicht durchgeführt. Eine Validierung des Schlüssels wird
empfohlen.
Ermittlung der künftigen Rolle der Fernerkundung für die Überwachung von Bergbaufolgelandschaften in Sachsen
Studiengang
MSc Geoinformationstechnologien
Verteidigungsdatum
22.01.2025
Betreuer
Matthias Forkel, Dr. Jan Kaplon (Wroclaw University of Environmental and Life Sciences)
Zusammenfassung
Die Ausbeutung der Lausitzer Landschaft für den Braunkohleabbau hat zu einer Störung der Umwelt geführt. Es werden umfangreiche Sanierungsmaßnahmen durchgeführt, um die ökologischen Funktionen wiederherzustellen, die Bedingungen zu stabilisieren und sozioökonomische Nutzungen zu fördern. Es ist unerlässlich, diese Maßnahmen zu überwachen, um sicherzustellen, dass die Sanierungsziele erreicht werden, und um potenzielle Gefahren für Mensch und Umwelt zu vermeiden, was angesichts der Größe des Gebiets und der Komplexität der Aufgaben mühsam ist. Diese Arbeit untersucht, wie Fernerkundungstechnologien die Überwachung von Bergbaufolgelandschaften im Lausitzer Bergbaurevier unterstützen und verbessern können und welche zukünftige Rolle sie in diesem Rahmen spielen werden. Zur Untersuchung wird ein mixed methods Ansatz verwendet. Dieser umfasst die Erhebung qualitativer Daten durch die Nutzung von Interviews und einer Umfrage mit dem Ziel, Einblicke in Rahmenbedingungen und angewandte Überwachungsmethoden zu erhalten. Darüber hinaus wird eine semi-systematische Literaturrecherche durchgeführt, um die Entwicklungen und potenziellen Anwendungen der Fernerkundung zu untersuchen. Die Fallstudien nutzen frei zugängliche Erdbeobachtungsdaten von Plattformen wie Sentinel-2 und MODIS, um die Vegetationsindizes NDVI und RSEI zu berechnen, die Bodenfeuchtigkeit zu modellieren und eine automatisierte Biotopkartierung mit einem Random-Forest-Algorithmus durchzuführen. Die Ergebnisse zeigen, dass Aufgaben klar auf die am Monitoring beteiligten Institutionen verteilt sind, während die rechtlichen Rahmenbedingungen Überwachungsstandards definieren und die Nutzung neuer, zuverlässiger Techniken fördern. Fernerkundungsdaten werden überwiegend in der geotechnischen Überwachung eingesetzt und geringfügig in der FFH-Überwachung und der Biotopkartierung in Form von Luftbildern. Sie finden keine Anwendung in der hydrogeologischen Überwachung. Das Verbesserungspotenzial ist in allen Monitoringbereichen gegeben, insbesondere im FFH-Monitoring durch die Verwendung von Umweltindizes und Metriken zur Bestimmung der Biodiversität. Der Nutzen der Umweltindizes NDVI und RSEI sowie des berechneten SSM-Modells wird durch Fallstudien unter Verwendung von Sentinel-1-, Sentinel-2- und MODIS-Daten validiert. Trotz der vielversprechenden Ergebnisse ist die SPM nur begrenzt auf Bergbauseen anwendbar, die geflutet werden. Schätzungen komplexer Biodiversitätsmerkmale, hyperspektrale Daten und automatisierte Biotopkartierung erfüllen nicht die Anforderungen der Vorschriften und werden in naher Zukunft nicht eingesetzt werden. LIDAR und möglicherweise zeitliche und räumlich verbesserte SARMethoden werden auch in Zukunft eine wichtige Rolle bei der geotechnischen Ereignisüberwachung spielen.
Eine Bewertung der Beziehung zwischen Luftqualität und Stadtmerkmalen anhand von Satellitendaten für Städte in der südlichen Hemisphäre
Studiengang
MSc Geoinformationstechnologien
Verteidigungsdatum
13.11.2024
Betreuer
Matthias Forkel, Peter Schauer (IABG)
Zusammenfassung
Laut der Weltgesundheitsbehörde leben 99 % der Weltbevölkerung in Orten, wo die Luftverschmutzung die empfohlenen Grenzwerte überschreitet. Insbesondere städtische Bevölkerungen sind aufgrund der hohen Bevölkerungsdichte, der Mobilitätsverhalten und der daraus entstehenden, erhöhten Schadstoffemissionen aus Industrie und Verkehr stark betroffen. Luftschadstoffe wie PM2.5, SO2, NO2 und CO haben schwerwiegende Konsequenzen auf die menschliche Gesundheit, weswegen ein präzises und zuverlässiges Monitoring unerlässlich macht. Bodenbasierte Messungen sind zwar zuverlässig, jedoch häufig mit höheren Kosten verbunden und räumlich begrenzt. Hingegen bieten satellitengestützte Messungen, insbesondere durch TROPOMI, eine globale Abdeckung und täglich hochaufgelöste Daten.
Diese Arbeit untersucht Städte der südlichen Hemisphäre. Dies stellt eine Region dar, die aufgrund von Überbevölkerung und rasanter Urbanisierung stark von Luftverschmutzung betroffen, jedoch weitestgehend unerforscht ist, insbesondere in Afrika südlich der Sahara, dem südlichen Ozean und der Antarktis. Mithilfe von linearen Regressionsmodellen wird der Zusammenhang zwischen Luftqualität und städtischen Merkmalen wie Bevölkerungsgröße, BIP pro Kopf, Anteilen an bebauter Fläche, Grünfläche und Industrieflächen, sowie die Küstennähe und Höhenlage in 84 Städten aus Afrika, Ozeanien und Südamerika analysiert.
Die Ergebnisse zeigen, dass es keine einheitlichen regionalen oder überregionalen Trends gibt, die diesen Zusammenhang widerspiegeln. Jedoch zeigen spezifische Faktoren eine unterschiedliche Einflussstärke je nach betrachteter Region. Dazu zählen die Bevölkerungsgröße, das BIP pro Kopf, die Lage, sowie der Anteil an Industrieflächen. In Ozeanien spielt die Bevölkerungsgröße eine entscheidende Rolle für die Luftqualität, während in Südamerika häufig Küstenstädte von höherer Luftverschmutzung betroffen sind. Interessanterweise haben der Anteil der Grünflächen oder der bebauten Flächen keinen signifikanten Einfluss auf die Luftqualität, wie anfangs erwartet wurde. Diese Erkenntnisse verdeutlichen die Komplexität der Bewertung von Luftqualität und legen nahe, dass zukünftige Forschung sich stärker auf stadtbezogene Analysen konzentrieren sollte.
Diese Arbeit bietet eine grundlegende Einsicht in den Zusammenhang zwischen bestimmten städtischen Merkmalen und der Luftqualität für Städte der Südhalbkugel, da sie eine der ersten Studien in diesem Bereich ist. Zukünftige Untersuchungen könnten davon profitieren, zusätzliche Merkmale wie Verkehr oder meteorologische Gegebenheiten zu berücksichtigen und komplexere Modelle wie Deep Learning Techniken anzuwenden.
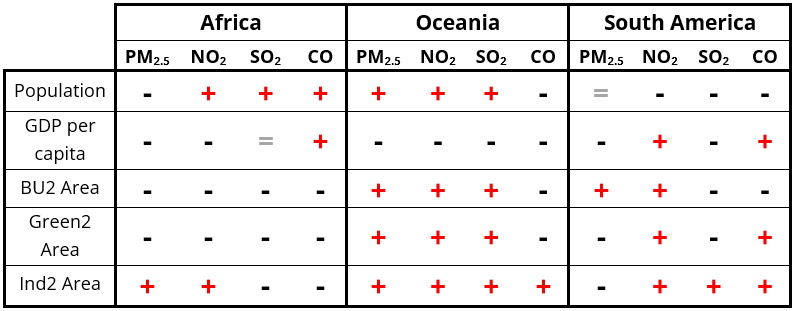
Grafische Zusammenfassung: Überblick über die bivariaten Regressionstrends zwischen den untersuchten Stadtmerkmalen und den Luftqualitätsindikatoren für die verschiedenen Regionen. Das „+“ steht für einen positiven Trend, d. h. einen Anstieg der Konzentration des Luftqualitätsindikators bei gleichzeitigem Anstieg des jeweiligen Stadtmerkmals. Das „-“ steht für einen negativen Trend und das „=“ für einen neutralen Trend.
Klassifikation von Vegetation in Tagebau-Folgelandschaften im Lausitzer Seenland mit RapidEye- und PlanetScope-Daten
Studiengang
Bachelor Geodäsie und Geoinformation
Verteidigungsdatum
24.10.2024
Betreuer
Matthias Forkel, Christopher Marrs
Zusammenfassung
Die Braunkohleförderung in offenen Tagebauen hat eine tiefgehende Veränderung der Kulturlandschaft zur Folge, wie in der Lausitz zu beobachten ist. Hier entsteht das Lausitzer Seenland in Folge der Flutung der Braunkohletagebaue des Lausitzer Braunkohlereviers. Eine Vielzahl der ehemaligen Tagebaue wurde bereits geflutet oder befinden sich noch in Flutung. Aktuell wird in noch drei Tagebauen aktiv Kohle gefördert, namentlich in den Tagebauen Nochten, Reichwalde und Welzow-Süd. Letzterer ist Gegenstand dieser Arbeit.
Die Braunkohleförderung im Tagebau Welzow-Süd begann im Jahr 1966 und endet voraussichtlich zwischen 2027 und 2030. Entgegen vieler Tagebaue im Lausitzer Revier wird Welzow-Süd nicht geflutet, sondern vollständig rekultiviert und renaturiert. Dieser Umstand macht den Tagebau für die Betrachtung der Veränderung der Landbedeckung mit Fokus auf die Vegetation im Rekultivierungsprozess mittels Satellitendaten besonders interessant.
Im Rahmen dieser Arbeit werden Landbedeckungskarten erstellt und konkrete Landnutzungsänderungen der Klassen in Hektar berechnet. Als Datenbasis dienen räumlich hochaufgelöste RapidEye- und PlanetScope-Daten mit einer Auflösung von 5 m. Die Landbedeckungsanalyse erfolgt anhand von vier Zeitpunkte im Frühsommer der Jahre 2009, 2015, 2019 und 2024 und umfasst acht Landbedeckungsklassen.
Die Landnutzungsklassifikation erfolgt mittels unüberwachtem k-means Clustering. Eingangsparameter sind die Spektralbänder von RapidEye und PlanetScope sowie der Normalized Difference Vegetation Index (NDVI) und der Normalized Difference Water Index (NDWI). Vor Anwendung des Clusteringalgorithmus wird das Tagebaugebiet in mehrere Teilflächen unterteilt, um Flächen mit gleichen Eigenschaften aber verschiedener Klassenzugehörigkeit zu trennen (beispielsweise Abraumhalden und offene Sandflächen).
Die Genauigkeitsanalyse liefert eine solide Gesamtgenauigkeit von 78 %. Zuverlässig werden Wald sowie Tagebau- und Abraumflächen erkannt. Schwierigkeiten bestehen bei der Differenzierung von kahlen Bodenflächen und brachliegenden Feldern sowie bei der Differenzierung zwischen „grünen“ Feldflächen, frisch aufgeforsteten Arealen und spärlich bewachsenen Gebieten. Übergänge zwischen Aufforstungs- und Waldflächen sind aufgrund der rein optischen Daten schwer definier- und differenzierbar. Zudem werden Wasserflächen nur unzureichend erkannt und müssen manuell ergänzt werden.
Dennoch zeigt sich das Potential von hochaufgelösten Satellitendaten für die Beobachtung von Tagebaugebieten und deren Folgelandschaften. Es besteht jedoch Verbesserungsbedarf in der Methodik, um das Potenzial der Fernerkundungsdaten voll auszuschöpfen. Denkbar ist der Einsatz eines anderen Klassifikationsalgorithmus wie des überwachten Random-Forest, der die Cluster des k-means Algorithmus als Referenzdaten nutzen könnte. Alternativ ließe sich die Datengrundlage für das k-means Clustering durch LiDAR-Daten, insbesondere Höhendaten, oder ein panchromatisches Band zur Ableitung von Texturmaßen erweitern.
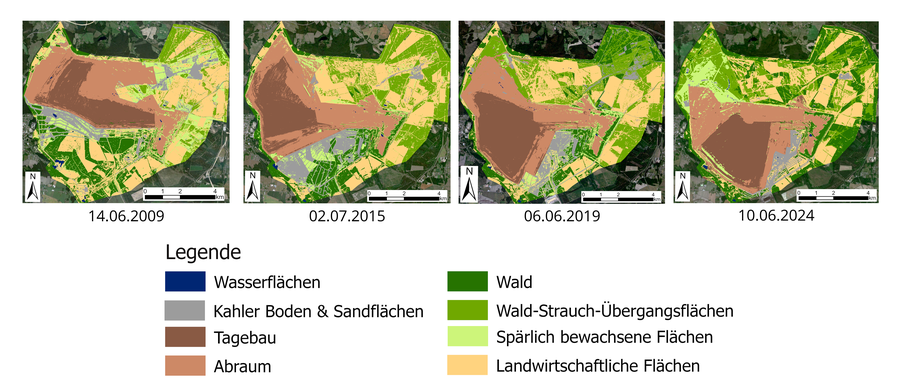
Graphische Zusammenfassung
Identifikation von Hotspots bezüglich Veränderungen der Vegetationsbiomasse - mit Schwerpunkt auf die Amazonas-Region
Studiengang
MSc Geodäsie
Verteidigungsdatum
05.09.2024
Betreuer
Christine Wessollek, Naixin Fan
Zusammenfassung
Eine genaue Quantifizierung des Kohlenstoffanteils der Vegetation (Cveg) und der Cveg-Veränderungen ist für das Verständnis des Kohlenstoffkreislaufs und die Eindämmung des Klimawandels von entscheidender Bedeutung. Fernerkundungsanwendungen haben sich zu einem wichtigen Instrument für die Schätzung des Kohlenstoffbestands entwickelt, aber eine optimale Kombination von Satellitenprodukten und Verarbeitungsmethoden bleibt ungewiss. Dies zeigt sich in der Entwicklung zahlreicher dynamischer Fernerkundungsdatenprodukte, die sich auf Cveg-Änderungen beziehen, mit unterschiedlichen Inputdaten, grundlegender Struktur und Anwendung. Die Masterarbeit vergleicht eine ausgewählte Anzahl dieser Datensätze, die zur Überwachung von Cveg und Cveg-Änderungen in den südamerikanischen Tropen mit Schwerpunkt auf dem Amazonasgebiet verfügbar sind, und bewertet deren Übereinstimmung. Die Studie schafft eine grundlegende Struktur für den Vergleich verschiedener Fernerkundungsprodukte zur Beobachtung von Vegetationsveränderungen und zeigt, dass eine aussagekräftige Bewertung in erster Linie für Hotspots von Vegetationsverlust durchgeführt werden kann, wobei die größte Übereinstimmung in flächenmäßig größeren Gebieten, die Verlust detektieren, und die größten Unstimmigkeiten bei kleineren Verlustereignissen zu verzeichnen sind. Es zeigt sich, dass die beste Übereinstimmung in erster Linie abhängig von Fläche - und nicht von den Werten der Vegetationsänderung (FVC) sind, und die größten Unstimmigkeiten stark von den Merkmalen der betrachteten Datensätze abhängig sind. Der letztendlich primäre Beitrag besteht nicht in einem umfassenden Vergleich der Übereinstimmung der Datensätze zu den Hotspots der Vegetationsveränderung, sondern in einer grundlegenden Methodik, dass eine aussagekräftige Bewertung der Übereinstimmung ermöglicht. Insgesamt zeigt die Studie, dass ein Vergleich zwischen sehr unterschiedlichen Datensätzen möglich ist, die Ergebnisse jedoch stark von den verwendeten Datensätzen abhängen. Um die Ergebnisse zu verbessern, sollten die Datensätze zunächst auf ihre Nützlichkeit und ihre Einschränkungen auf den Vergleich geprüft werden. Die Studie liefert Vorschläge für künftige Vergleiche von dynamischen Cveg-Datensätzen mit ähnlichen Merkmalen und stellt eine grundlegende Erwartung an die Ergebnisse der Bewertung der Analyse für speziell Datensätze, die sich auf Vegetationsverlust beziehen.
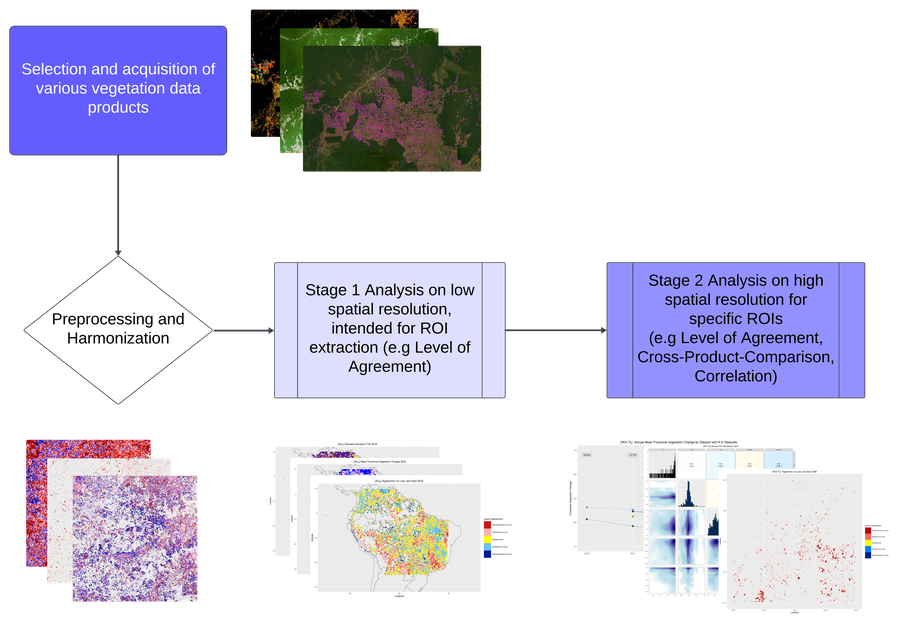
Graphical abstract
Methodenentwicklung zur Klassifikation der Befahrbarkeit von Waldwegen für Einsatzfahrzeuge mittels offener Geodaten
Studiengang
MSc Geodäsie
Verteidigungsdatum
16.05.2024
Betreuer
Matthias Forkel, Patrick Brausewetter (Fraunhofer Inst. für Verkehrs- u. Infrastruktursysteme)
Zusammenfassung
Der fortschreitende Klimawandel mit stärker zunehmenden Hitze- und Dürreperioden führt zu einem Anstieg des allgemeinen Waldbrandrisikos. Während mehrerer Waldbrände im Nationalpark Sächsische Schweiz im Sommer 2022 offenbarten sich für die verschiedenen Einsatzkräfte vor Ort diverse Herausforderungen: äußerst lange und zeitaufwändige Marsch- und Anfahrtswege aufgrund der anspruchsvollen Topographie des Nationalparks sowie vereinzelter, weit auseinander liegender Brandstellen in Verbindung mit den unzureichenden Kartengrundlagen des Gebietes erschwerten die Einsatzplanung. Vorhandenen Studien zur Erkennung und Kartierung von Wegen bzw. Straßen in bewaldeten Regionen fehlt der spezielle Fokus auf die Anforderungen von Einsatzkräften, die die Daten im Einsatz zur Koordinierung und Navigation benötigen und diese schnell interpretieren müssen. Ziel dieser Arbeit ist es deshalb, eine Methode zu entwickeln, mittels offener Geodaten und Open Source Software sowohl befestigte als auch unbefestigte Waldwege zu erkennen, zu extrahieren und entsprechend der Befahrbarkeit nach den Anforderungen von Einsatzkräften zu klassifizieren. Experteninterviews mit Einsatzkräften vom Technischen Hilfswerk (THW) und der Feuerwehr, welche am Einsatz 2022 beteiligt waren, dienten dazu, eine entsprechende zielführende Wege-Klassifizierung zu entwickeln. Es wird eine Methode vorgestellt, in der durch die Vorprozessierung von Airborne-Laserscan-Daten und Digitalen Orthophotos des Landesamts für Geobasisinformation (GeoSN), sowie aus den die Waldwege repräsentierenden OSM-Vektorlinien (OpenStreetMap) Multilayer-Raster erstellt werden. Diese Raster umfassen ein Untersuchungsgebiet von 4 Kacheln zu je 2km x 2km. Es wird ein pixelbasierter überwachter Klassifizierungsalgorithmus, ein Random Forest, angewendet, um das Untersuchungsgebiet in die Klassen Road und Non-Road zu teilen. Im Ergebnis werden diese Klassenvorhersagen mit den OSM-Wegen verglichen. Es ergibt sich dabei eine allgemeine Genauigkeit von über 95%. Zur detaillierten Betrachtung werden zudem die Genauigkeitsmerkmale Completeness, Correctness und Quality der Klasse Road herangezogen, wobei sich niedrige Werte von 14-35%, 12-24% und 7-14% ergeben. In der Arbeit wird die Hauptfehlerquelle dafür erkannt und diskutiert, und dadurch die Wichtigkeit genauer Ground-Truth-Daten verdeutlicht. Entsprechend wird von der Nutzung von OSM-Wegen als Datengrundlage abgeraten. Schlussendlich wird gezeigt, dass die entwickelte Methode einen guten reproduzierbaren Ansatz bietet. In der Arbeit werden Anpassungs- und Ausbaumöglichkeiten der Methode vorgestellt und diskutiert, die zukünftig zu einer Effizienzsteigerung während der beschriebenen Waldbrandeinsätze beitragen können.
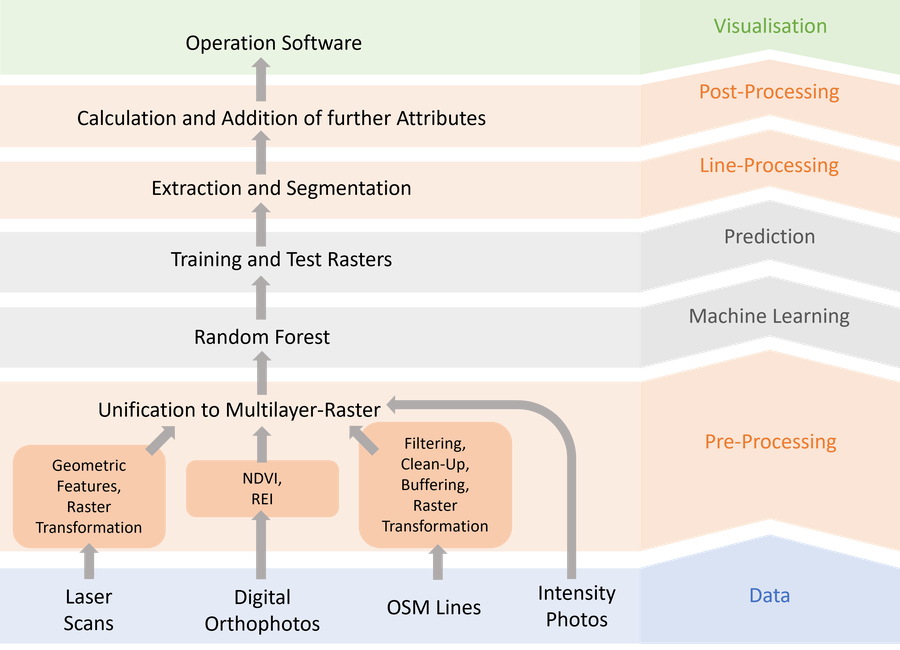
Graphical abstract
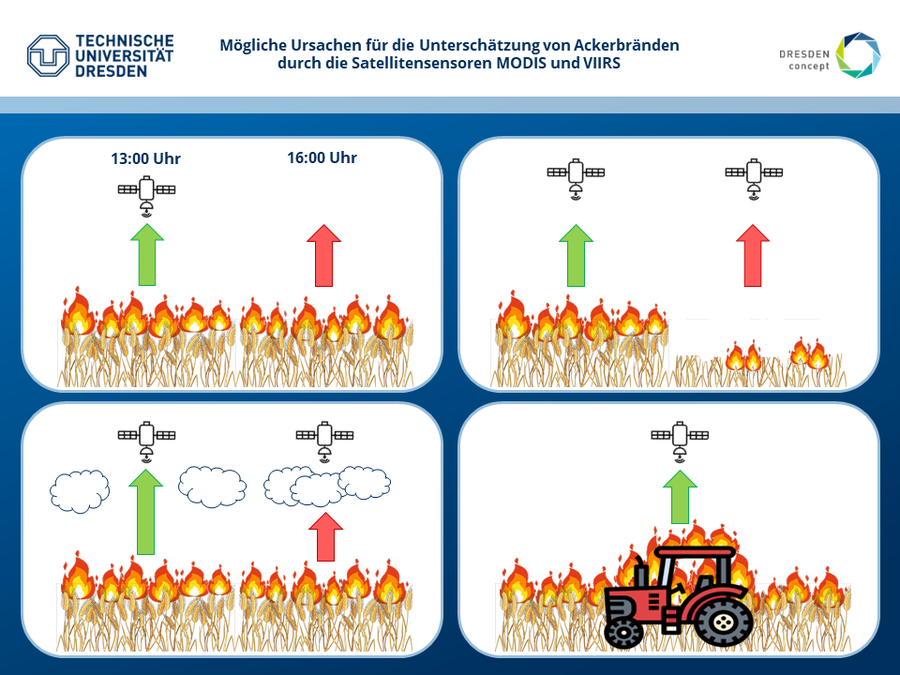
Bewertung der Genauigkeit der Sensoren VIIRS und MODIS zur Detektion von Bränden auf landwirtschaftlichen Flächen im Raum Sachsen, Sachsen-Anhalt und Thüringen
Studiengang
Bachelor Geographie
Verteidigungsdatum
06.02.2024
Betreuer
Christine Wessollek, Christopher Marrs
Zusammenfassung
Brände auf Ackerflächen haben schwerwiegende Folgen für die menschliche Gesundheit und den Klimawandel. Einerseits verschlechtern sie lokal die Luftqualität, andererseits gelangen ihre Emissionen global in die Atmosphäre, wodurch der Treibhauseffekt verstärkt und der Klimawandel begünstigt werden. Außerdem können die beim Brand entstehenden Rußpartikel polwärts getragen werden und dort den Albedo-Effekt reduzieren. Viele Ackerflächen werden in Brand gesetzt, nachdem sie abgeerntet wurden, um übriggebliebene Erntereste schnell und kostengünstig zu entfernen und das Feld für die nächste Aussaat vorzubereiten. Wegen der zahlreichen negativen Folgen von Ackerbränden wurde diese gängige Praxis der Landwirtschaft durch die Europäischen Union verboten. Trotz der Verbote widersetzen sich einige Bauern den Vorschriften und setzen nach wie vor ihre Felder in Brand. Gerade in Ländern, die nicht zur Europäischen Union gehören, werden nach wie vor Felder abgebrannt nach der Ernte. In Deutschland konnte das beabsichtige Abbrennen von Ackerflächen gut eingedämmt werden. Viele Ackerbrände entstehen allerdings auch ungewollt während der Erntearbeiten. Bei den hohen Sommertemperaturen entzündet sich Staub, der sich im Motorraum ablagert, sehr leicht, oder es entstehen Funken durch Steine, die am Schneidewerk der Maschinen reiben. Um die dabei entstehenden Emissionen zu erfassen und die Folgen für den Klimawandel und die lokale Luftqualität abschätzen zu können, ist eine zuverlässige Dokumentation solcher Brände von Nöten. Auch können somit illegal entzündete Felder ausfindig gemacht. Dafür sind die Satelliten-Sensoren MODIS und VIIRS gut geeignet, die tagsüber jeweils bis zu vier Mal die mittleren Breitengrade überfliegen. Allerdings unterschätzen beide Sensoren nach wie vor sehr viele Brände. Bisher wurde das mit ungünstigen Überflugzeiten, zu geringem Ausmaß der Brände und zu starker Wolkenbedeckung begründet. In dieser Arbeit wurden 46 Ackerbrände in Mitteldeutschland aus dem Jahr 2023 aus Zeitungsartikeln und Einsatzberichten im Internet recherchiert und ihre Detektion durch die Satelliten MODIS und VIIRS überprüft. Zusätzlich wurden Brandeigenschaften wie beispielsweise Feldbedeckung, Wolkenbedeckung oder Brandfläche untersucht, um mögliche Gründe für die Unterschätzung der Brände herauszufinden. Die Untersuchung ergab, dass der MODIS-Sensor bei der Detektion der Brände sehr schlecht abgeschnitten hat. Es wurde nur ein Brand von ihm erkannt, was vor allem auf die geringere räumliche Auflösung des Sensors von einem Kilometer zurückzuführen ist. Der VIIRS-Sensor detektierte ungefähr ein Drittel aller Brände. Seine räumliche Auflösung liegt bei 375 Metern. MODIS hat zudem keine so große Scanbreite wie VIIRS, wodurch es insgesamt weniger Überflüge von MODIS gab. Zwei Drittel aller Brände blieben von beiden Sensoren unentdeckt, was vor allem an zu wenig Überflügen liegt. Die Brände entstanden hauptsächlich am Mittag und frühen Nachmittag. Weil die Überflüge hauptsächlich mittags stattfanden, wurden viele der Brände am Nachmittag oder Abend nicht mehr überflogen und hätten nicht detektiert werden können. Auch die Feldbedeckung scheint die Detektionswahrscheinlichkeit der Ackerbrände zu beeinflussen. Felder, die vor dem Brand bewachsen waren, wurden häufiger erkannt als abgeerntete Ackerflächen. Ackerbrände unter klarem Himmel wurden ebenfalls häufiger detektiert als Brände, die von Wolken bedeckt waren. Es wird ein Zusammenhang zwischen zusätzlichen Brandereignissen wie Kleingartenanlagen oder Erntemaschinen vermutet, weil dadurch die Brandintensität und die Menge an emittierter Infrarotstrahlung steigt. Dieser Zusammenhang konnte jedoch nicht abschließend bestätigt werden. Ackerbrände, bei denen zusätzlich ein Waldstück in Flammen stand, scheinen die Wahrscheinlichkeit einer Detektion nicht zu begünstigen, solange nur der Waldboden brennt, weil die ausgesandte Infrarotstrahlung des Waldbodens von den Baumkronen abgeschirmt wird. Faktoren wie Branddauer oder -fläche hatten keinen direkten Einfluss auf die Detektionswahrscheinlichkeit. Bei der Detektion von Ackerbränden kommt es nicht auf die gesamte verbrannte Fläche an, sondern auf die Intensität der momentanen Feuerfront zum Zeitpunkt der Satelliten-Überflüge.
Grafische Zusammenfassung
Möglichkeiten der Klassifizierung von Feuchtgrünland mit Sentinel-2-Zeitreihen
Studiengang
MSc Geoinformationstechnologien
Verteidigungsdatum
29.01.2024
Betreuer
Christine Wessollek, Anna Cord
Zusammenfassung
Feuchtgrünland besitzt eine hohe Bedeutung für die Biodiversität und erfüllt vielfältige Ökosystemfunktionen. Die naturschutzrechtlichen Verpflichtungen zum Schutz von Feuchtgrünland auf Basis nationaler und internationaler Gesetze und Regelungen erfordern eine regelmäßige Überwachung. Der Zustand wird im Rahmen von terrestrischen Kartierungen, oft nur in großem zeitlichen Abstand erfasst. Als Entscheidungsgrundlage für Maßnahmen und zur Überprüfung der Zielerreichung wäre aber eine häufigere Aktualisierung erforderlich. Sentinel-2-Fernerkundungsdaten liegen in hoher zeitlicher Auflösung vor, eine Nutzung für das Grünlandmonitoring ist bisher bundesweit aber nicht etabliert. Die Untersuchungen im Rahmen dieser Arbeit konzentrieren sich auf drei Schwerpunkte: eine Suchraumanalyse für die Ableitung der Grünlandmaske, die Auswertung von FE-Daten und verschiedene Modellberechnungen. Anhand der terrestrischen Erfassungsdaten aus der Biotopkartierung zweier Untersuchungsgebiete (UG) in Sachsen und Schleswig-Holstein, wurden zwei verschiedene Datenquellen (Digitales Landschaftsmodell und Copernicus Grünland) für die Eignung als Grünlandmaske analysiert und in Bezug auf die Repräsentanz für die Zieltypen verglichen.
Für den Feuchteaspekt wurde der topographische Feuchteindex (TWI) sowie die Zeitreihen dreier spektraler Indizes (MNDWI, NDMI und TCW) aus den FE-Daten des Jahres 2022 ausgewertet. Für die Vegetation wurden vier Merkmale (grünes Band, Red Edge-Bänder 1+3 und EVI) im Hinblick auf drei Grünlandgruppen unterschiedlicher Feuchtestufen (nass / feucht / frisch) statistisch bewertet. Dabei ergab sich nur eine teilweise Übereinstimmung hinsichtlich der am stärksten differenzierenden Variablen zwischen den beiden UG. Für das UG Vogtland waren der NDMI und TCW im Sommer und der mNDWI im Winter bedeutsam. Im UG Sorgeniederung war der mNDWI im Winter und Sommer, der NDMI im Winter und Frühling und der TCW im Sommer am wichtigsten. In Bezug auf die Vegetation wirkten im UG Vogtland eher die Sommer- und Herbstaufnahmen der Indices differenzierend, während im UG Sorgeniederung eher die Frühjahrs und Herbstdaten der Indices für die Unterscheidung nützlich waren. Die identifizierten Merkmale dienten anschließend als Eingangsdaten für Klassifikationsmodelle. Variierende Modelle in Bezug auf die Merkmalsauswahl, den Umfang der Eingangsdaten, die Modellparameter, die Zielklassen sowie zeitliche und räumliche Parameter wurden unter Verwendung von Verfahren des maschinellen Lernens (ML) berechnet. Als Klassifikationsalgorithmen wurden Random Forest (RF) und Support Vector Machine (SVM) vergleichend genutzt. Die differenzierenden Merkmale der statistischen Auswertung und die Merkmalsbedeutung der berechneten Modelle stimmten nur teilweise überein. In vielen Modellen waren die Feuchteindices und der TWI unter den zehn wichtigsten Merkmalen. Beim jeweils genauesten Modell waren im UG Vogtland (M36) und im UG Sorgeniederung (M20) drei der fünf wichtigsten Merkmale feuchtebezogen. Modelle mit höherer, einheitlicher Stichprobenzahl pro Grünlandgruppe erreichen in Bezug auf das Feuchtgrünland höhere Genauigkeiten als Modelle mit stratifizierten Trainings- und Testdatensätzen. Das Entfernen korrelierender Merkmale verbesserte ebenfalls die Modellgenauigkeit. Die Gruppe „feucht“ wies in nahezu allen Modellvarianten die meisten Fehlklassifikationen auf. Der F1-Wert für diese Gruppe lag bei fast allen Modellen unter den Werten für die Gruppen „nass“ und „frisch“. Die Genauigkeit der verschiedenen Klassifikationsmodelle variierte sehr stark (Kappa- Wert zwischen k=0,13 und k=0,7) und auch die F1-Werte für die Feuchtgrünlandgruppe wiesen eine große Schwankungsbreite auf (0,11 bis 0,73). RF erreichte bei der Modellberechnung eine höhere Genauigkeit als SVM, aber der Einfluss des Klassifizierers lag bei gleichen Eingangsdaten deutlich unter dem Einfluss der Merkmalsauswahl und der Modellparameter.
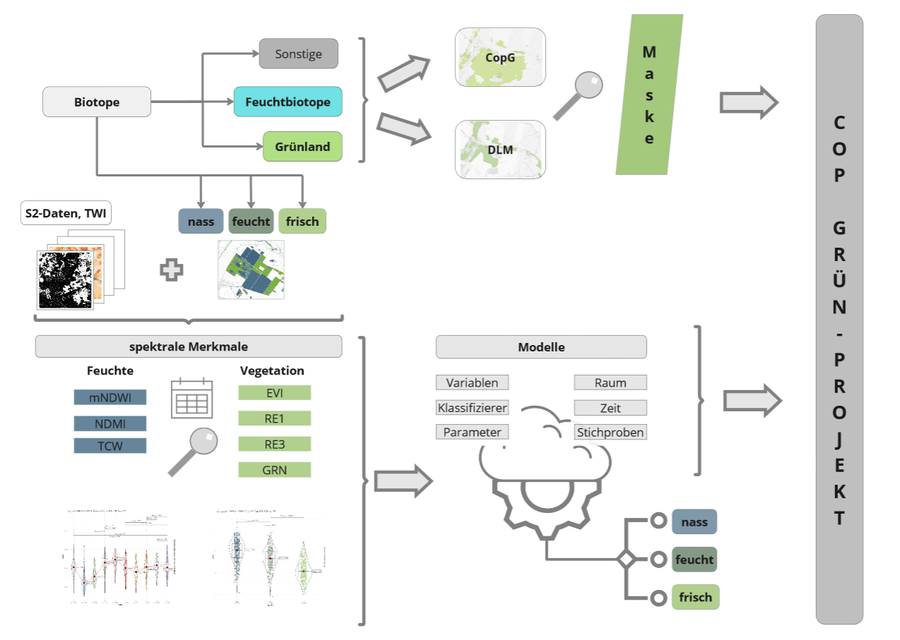
Grafische Zusammenfassung
Potential der Fernerkundung für die Kartierung von Korallenriffen und historischen Veränderungen in niedrigen Küstengewässern von Bonaire
Studiengang
MSc Geoinformationstechnologien
Verteidigungsdatum
25.01.2024
Betreuer
Matthias Forkel, Sander Mücher (Wageningen University and Research)
Zusammenfassung
Die Zerstörung von Korallenriffen ist ein gut dokumentierter und leider weltweit anhaltender Prozess. Dieser Prozess wird durch zunehmende menschliche und nicht-menschliche Stressfaktoren verursacht, die einen großen Einfluss auf die Korallenriffe haben. Die Stressoren wirken sich auf verschiedenen Ebenen aus, z. B. lokal (z. B. Tourismus), regional (z. B. Flüsse in Südamerika) und global (z. B. Klimawandel). Eine der Hauptschwierigkeiten bei der Überwachung von Korallenriffen ist der Mangel an historischen Daten mit einem großen räumlichen Umfang. Die Verwendung historischer Luftaufnahmen in Kombination mit neueren, hochauflösenden Satellitenbildern kann ein leistungsfähiges Instrument sein, um Veränderungen zu erkennen. Die Vorteile dieser RS-Techniken wurden bereits in verschiedenen Gebieten der Welt diskutiert. In dieser Arbeit werden RS-Techniken auf historische Zeitreihen von Bildern der flachen Küstengewässer der Leeseite von Bonaire angewandt, um ihr Potenzial zur Unterstützung künftiger Überwachungsprozesse zu bewerten. Es wird gezeigt, dass die Analyse von Zeitreihen weltraum- und flugzeuggestützter Bilder in Kombination mit In-situ-Messungen zuverlässige räumliche Informationen über Korallenbedeckung und Sandflecken in flachen Küstengewässern liefern kann. Mit einer Gesamtgenauigkeit von 70% liefern die Bildklassifizierungen angemessene bis gute Informationen, insbesondere für Korallen und Sand. Darüber hinaus werden in dieser Arbeit historische Luftbildaufnahmen verwendet, um Veränderungen des Korallenriffs in den letzten 60 Jahren zu erkennen und mit verschiedenen Informationsquellen zu vergleichen. Die Zeitreihenanalyse historischer Bilder belegt starke Veränderungen der Korallenbedeckung, mit einem Verlust von 40% zwischen 1961 und 2020/2021, und stellt diese in einem räumlichen Kontext dar. Die Degradation des Riffs und die Ausbreitung von Sandflecken variiert stark zwischen verschiedenen Gebieten und über die Zeit. Es zeigt sich, dass der Rückgang der Korallenbedeckung in den letzten Jahrzehnten zwar nicht gestoppt, aber verlangsamt wurde, und in einem Teil des Untersuchungsgebiets wurde eine Zunahme der Korallenbedeckung beobachtet. Diese Untersuchung zeigt den Nutzen und die Aussichten der Fernerkundung für die Kartierung aquatischer Lebensräume und weist darauf hin, was notwendig ist, um den Arbeitsablauf in Zukunft zu verbessern.
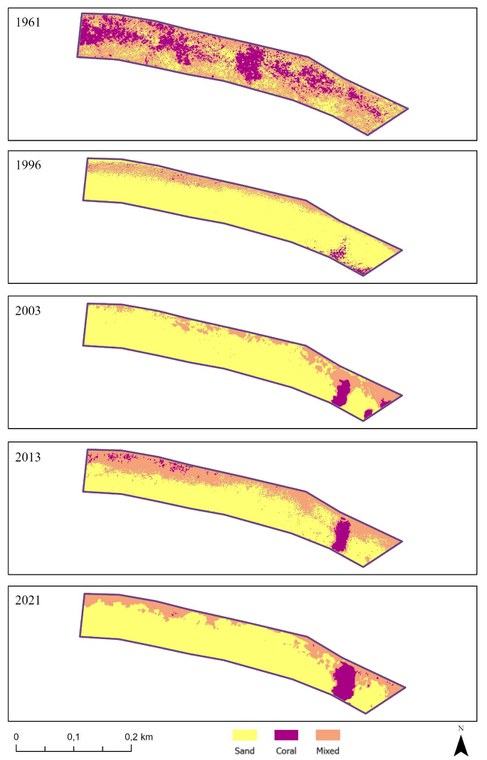
Ausschnitt aus den Kartierungsergebnissen
Detektion und Untersuchung von Waldbrand-Rauchwolken mit Sentinel-5p
Studiengang
MSc Geodäsie
Verteidigungsdatum
13.12.2023
Betreuer
Matthias Forkel, Jos de Laat (KNMI)
Zusammenfassung
Das Verständnis über die Dynamik und Eigenschaften von Rauchwolken aus Waldbränden ist für die Umweltüberwachung und politische Entscheidungsträger von großer Bedeutung. Diese Rauchwolken können weitreichende Folgen für das globale Klima, die Luftqualität und die Gesundheit haben. In dieser Studie wird ein datenbasierter Ansatz zur Erkennung und Charakterisierung von Rauchwolken aus Waldbränden unter Verwendung von TROPOMI (Tropospheric Monitoring Instrument) des Sentinel-5p-Satelliten zur Beobachtung von Stickoxiden [NOx], Kohlenmonoxid [CO], Methan [CH4], Formaldehyd [HCHO] und Aerosolen entwickelt. VIIRS Active Fire Daten werden verwendet, um Brände zu identifizieren und lokalisieren. Die primäre Hypothese dieser Studie ist, dass eine Rauchwolke aus drei Hauptkomponenten besteht: einem Körper oder Kern, einer Übergangszone von der Rauchwolke zum klaren Himmel und dem klaren Himmel selbst. Um diese Hypothese zu realisieren, wurde ein datenbasierter, unüberwachter Algorithmus zur Identifizierung und Kartierung von Rauchwolken entwickelt. Dieser basiert auf Kernel-Funktionen zur Vorprozessierung der TROPOMI Bilder. Diese Kernel heben die mit Rauchwolken zusammenhängenden Merkmale wirksam hervor und ermöglichen eine genaue Unterscheidung. Anschließend werden Gaussian Mixture Models (GMM) verwendet, um die Bilder entsprechend der Haupthypothese in drei Komponenten der Rauchwolke zu klassifizieren. In Fällen, in denen mehrere Rauchwolkenkandidaten existieren, wird eine Gaußsche Abstandsgewichtungsfunktion zur Identifizierung des wahrscheinlichsten Kandidaten verwendet. Darüber hinaus werden die Detektionen der Übergangszonen zwischen Rauchwolke und reiner Luft mit Hilfe einer Monte- Carlo-Simulation evaluiert, um die Übergangszonen zu validieren. Zur Überprüfung der Erkennungen werden Rauchwolken von CH4, CO, HCHO, NO2 und Aerosolen über dem Amazonas und Alberta extrahiert und deren Eigenschaften mit verschiedenen Landbedeckungsarten in Relationen gesetzt. Die Ergebnisse dieser Studie liefern wertvolle Einblicke in die Entwicklung einer fortschrittlichen Methodik zur Erkennung von Rauchwolken, die weitreichende Auswirkungen auf das Verständnis und die Überwachung von Brandemissionen und die Atmosphärenforschung hat.
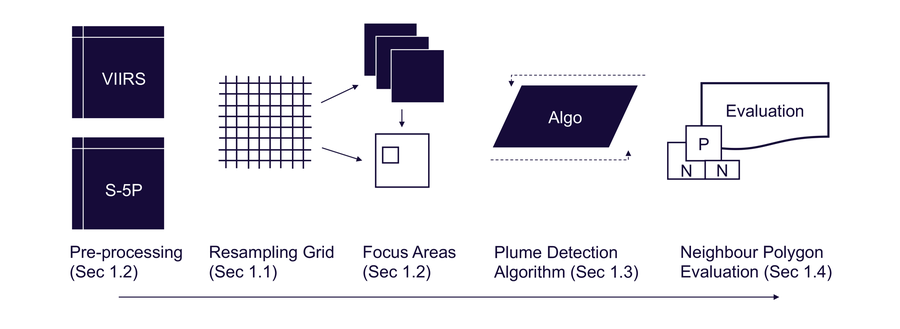
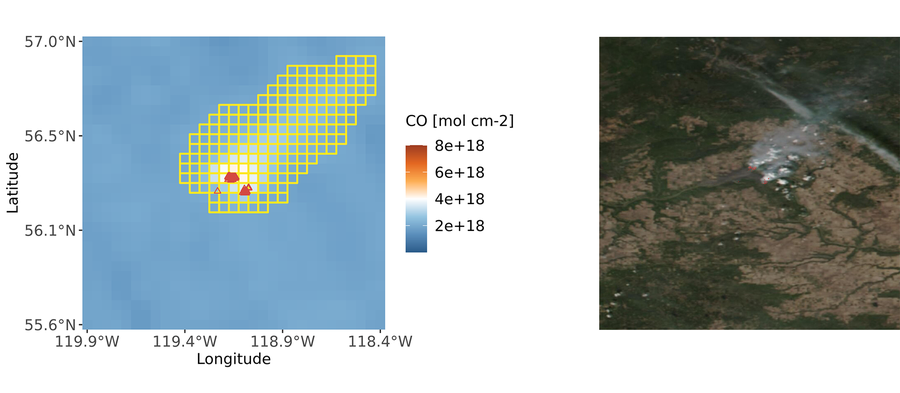
Workflow der Prozessierung und Beispielergebnis einer NO2-Rauchwolkendetektion in Alberta
Kombination neuartiger Visualisierungen zeitlicher Veränderungen mit Karten unter Verwendung von Satellitenzeitreihen der Vegetationsfeuchtigkeit
Studiengang
MSc Cartography
Verteidigungsdatum
23.11.2023
Betreuer
Matthias Forkel, Barend Köbben (U Twente)
Zusammenfassung
Diese Arbeit bietet einen praktischen und theoretischen Überblick über die Visualisierung von Zeitreihendaten für den Feuchtigkeitsgehalt von Brennstoffen, den Feuerwetterindex und die Temperatur, die alle eine wichtige Rolle bei der Vorhersage des Auftretens und der Ausbreitung von Waldbränden spielen. Die Studie untersucht verschiedene Techniken, darunter die Kombination neuartiger Visualisierungen von Warming Stripes und der Klimaspirale mit Karten, um die multivariaten Daten dieser Brandrisikofaktoren darzustellen. Eine Visualisierung verwendet das Farbschema der Warming Stripes und kleine Multiplikatoren, um die Entwicklung und den Vergleich aller drei Variablen im Laufe der Zeit darzustellen. Eine andere Visualisierung verbindet die Klimaspirale mit Choroplethen-Karten, um die Saisonalität und die Zugänglichkeit der Daten für den Feuchtegehalt von Brennstoffen und den Feuerwetterindex zu verdeutlichen. Darüber hinaus wird in dieser Arbeit ein Bewertungsrahmen erstellt, der die Überlegenheit der erstellten Visualisierungen im Vergleich zu anderen ausgewählten räumlich-zeitlichen Visualisierungen aufzeigt. Darüber hinaus schließt diese Arbeit eine Lücke in der Literatur, indem sie den Bekanntheitsgrad und die Effektivität von Warming Stripes bewertet. Die Umfrageergebnisse haben jedoch den Ruf dieser Visualisierung nicht bestätigt.
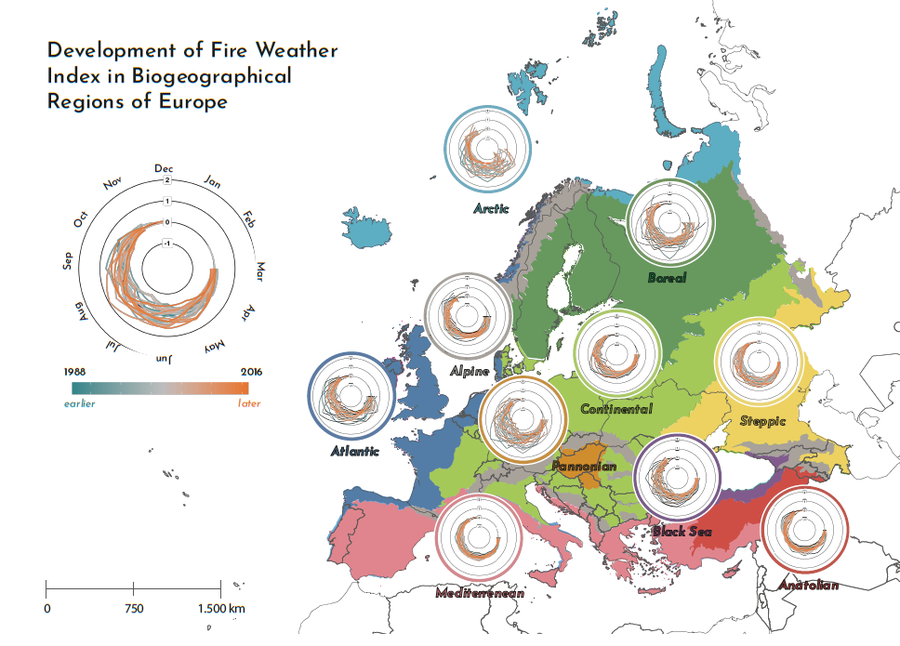
Modifikation der Klimaspirale mit Feuerwetter-Index
Kartierung und Analyse der menschlichen Exposition gegenüber Waldbränden im mitteleuropäischen Kontext
Studiengang
MSc Cartography
Verteidigungsdatum
23.11.2023
Betreuer
Matthias Forkel, Mahdi Khodadadzadeh (U Twente)
Zusammenfassung
Der Klimawandel hat in Südeuropa zu einer spürbaren Zunahme katastrophaler Waldbrände geführt. Aber auch Mitteleuropa ist vor solchen zerstörerischen Ereignissen nicht gefeit, wie ein kürzlich aufgetretener Waldbrand zeigte, der große Teile des Nationalparks Sächsische Schweiz in Deutschland und des Nationalparks Böhmische Schweiz in der Tschechischen Republik verbrannte. Dies war eine Warnung für die wissenschaftliche Gemeinschaft und die lokalen Akteure, die deutlich machte, dass man sich auf diese neue Realität einstellen muss. In diesem Zusammenhang wird in dieser Arbeit versucht, eine Karte zur Vorbereitung auf Waldbrände für ein Gebiet zu erstellen, das die beiden betroffenen Nationalparks sowie zwei angrenzende Naturschutzgebiete umfasst. Diese Karte soll das Ausmaß der Gefährdung menschlicher Siedlungen durch Waldbrände in diesem Gebiet veranschaulichen. Die Karte hat die Form einer webbasierten interaktiven Karte. Zu diesem Zweck wurden neun Waldbrandszenarien entwickelt, die auf unterschiedlichen Waldbranddauern und Wetterbedingungen basieren. Die Karte wurde mit der breiten Öffentlichkeit auf ihre Benutzerfreundlichkeit und mit Interessengruppen auf ihre Nützlichkeit hin getestet. Außerdem wurden Validierungstests mit historischen Waldbranddaten für das Untersuchungsgebiet durchgeführt.
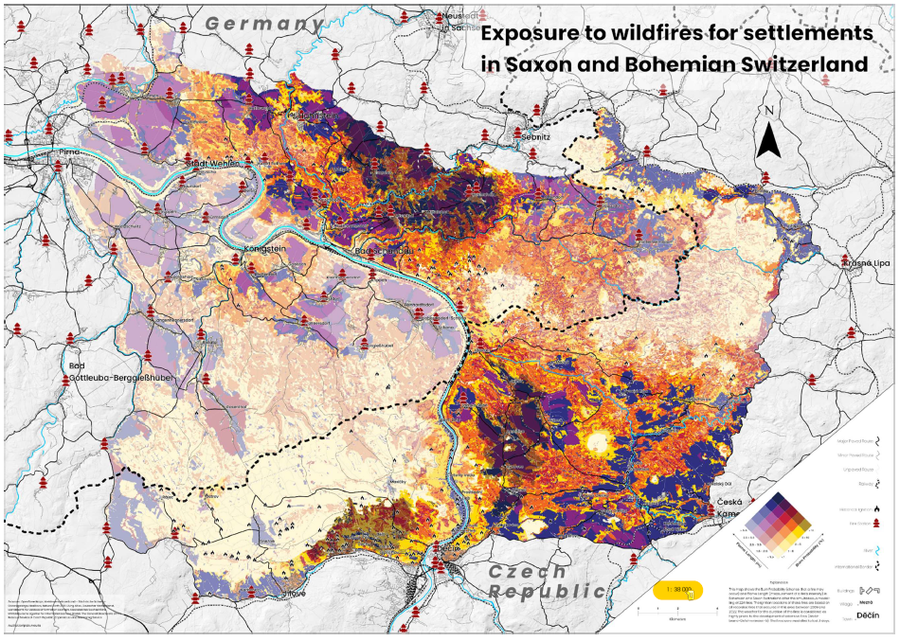
Statische Expositionskarte für das Waldbrandszenario WBI = 5, Dauer = 3 Tage. Die tatsächliche Kartengröße ist A0.
Ermittlung von Verfahren zur Ableitung eines Indikators zur Bestimmung des vegetativen Trockenstress in Grünlandgebieten auf Basis von Fernerkundungsdaten in Sachsen
Studiengang
MSc Geodäsie
Verteidigungsdatum
10.08.2023
Betreuer
Christine Wessollek, Sebastian Goihl (LfULG)
Zusammenfassung
Dürre und Trockenstress erhalten in Zeiten des Klimawandels eine immer stärkere Bedeutung. Das primäre Ziel dieser Studie ist die Entwicklung einer Methode zur Ableitung eines Indikators, der dazu dient, Dürre in den Grünlandgebieten von Sachsen zu identifizieren. Dieser Indikator soll das Potenzial besitzen, in das sächsische Klimafolgen-Monitoring des Landesamt für Umwelt, Landwirtschaft und Geologie (LfULG) integriert zu werden, mit dessen Zusammenarbeit diese Arbeit entstand. Für die Entwicklung der Methode wurden vier Untersuchungsgebiete in Sachsen gewählt. Diese liegen in den landwirtschaftlichen Vergleichsgebieten 111 Düben-Dahlener Heide, 221 Sächsiche Elbtalniederung, 232 Elbsandsteingebirge und Zittauer Gebirge und 351 Erzgebirgskamm. Die landwirtschaftlichen Vergleichsgebiete Sachsens sind Gebietszusammenfassungen des Freistaat Sachsen mit ähnlichen Standortfaktoren wie Bodeneigenschaften, Klima und Höhenlage beziehungsweise Relief. Die Datengrundlage bilden frei verfügbare und mit Sen2Cor atmosphärenbereinigte Sentinel-2 Daten und monatliche DWD-Niederschlagsdaten. Mit den vorliegenden Sentinel-2 Daten wurden die folgenden Indizes berechnet: Normalized Difference Vegetation Index (NDVI), Normalized Difference Water Index (NDWI), Normalized Difference Drought Index (NDDI), Normalized Multiband Drought Index (NMDI), Vegetation Condition Index (VCI) des NDVI und NDWI. Aus den monatlichen Niederschlagsdaten wurde der Standardized Precipitation Index (SPI) berechnet. Diese Daten bilden die Grundlage für die Erprobung von zwei Machine-Learning-Ansätzen, konkret Random Forest und Support-Vector Regression. Mit diesen Daten und Ansätzen wurde in dieser Arbeit getestet, ob der Jahresertrag für Grünland als Indikator für Dürre bzw. Trockenstress dienen kann und ob die Ertragsabschätzung mit den genannten Dürreindizes möglich ist. Der Untersuchungszeitraum enthält die Jahre 2015 bis 2021 und die Monate April bis September. Als Zielgröße für das Training der Machine-Learning Ansätze dienen gemittelte Jahreserträge der jeweiligen Vergleichsgebiete. Drei Hauptforschungsfragen wurden in dieser Arbeit thematisiert: 1. Kann der Jahres-Ertrag als Indikator für Dürre auf Grünlandflächen in Sachsen dienen? 2. Ist es möglich, den Jahresertrag von Grünlandflächen mithilfe von Satellitenindizes aus Sentinel-2-Daten, die für das Dürremonitoring verwendet werden, sowie dem SPI abzuschätzen? 3. Kann Machine-Learning, insbesondere Random-Forest und Support-Vector-Regression, zur Ertragsabschätzung genutzt werden? Für das Schätzen fehlender Werte, durch beispielsweise Wolkenbedeckung, wurden zwei Methoden angewendet. Zum einen wurde rfImpute des randomForest Package und zum anderen bagImpute des caret Package in R genutzt. Die Ergebnisse mit dem Testdatensatz der beiden Machine-Learning Ansätze, welcher alle Grünlandflächen der 4 Untersuchungsgebiete des Jahres 2018 enthält, ergeben einen RMSE von 12,57 dt/ha und 11,25 dt/ha mit den besten Tuning-Parametern bei absoluten Erträgen zwischen 26,75 dt/ha und 42,55 dt/ha. Mit den vorliegenden Ergebnissen dieser Arbeit konnten die Forschungsfragen nicht genügend beantwortet werden. Es werden einige Modellverbesserungen empfohlen. Unter anderem die Verwendung von Grünland-Erträgen mit einer höheren räumlichen und zeitlichen Auflösung für das Training und der Verwendung von Indizes mit einer geringeren Korrelation untereinander.

Performance-Ergebnis eines RF-Modells
- External PhD student at the Max Planck Institute for Biogeochemistry Jena, co-supervised by Matthias Forkel
- Website at MPI-BGC
- Dissertation: Terrestrial vegetation-water interactions in observations and models https://nbn-resolving.org/urn:nbn:de:bsz:14-qucosa2-879330
- Defense: 05.06.2023
Vergleich von Algorithmen zur Kartierung von Überflutungsflächen anhand Sentinel-1 Daten
Studiengang
MSc Geoinformationstechnologien
Verteidigungsdatum
03.05.2023
Betreuer
Matthias Forkel, Sebastian Goihl (LfULG)
Zusammenfassung
Im Rahmen dieser Masterarbeit wird eine vergleichende Analyse von Algorithmen zur Kartierung von Überschwemmungsgebieten anhand von Sentinel-1-Daten durchgeführt, wobei der Schwerpunkt auf der mittleren Schwellenwertbildung, dem Otsu-Thresholding, dem Multi-Otsu-Schwellenwertbildung und dem Random Forest (RF) Machine Learning-Algorithmus liegt. Das Hauptziel der Studie ist es, die Effektivität und Genauigkeit dieser Algorithmen bei der Erkennung und Kartierung der vom Hochwasser betroffenen Gebiete zu bewerten. Zu den untersuchten Regionen gehören das Ahrtal und das Tal der Sauer und Kyll, wobei die Daten für das Training und die Validierung des Modells in separate Regionen aufgeteilt wurden. Eine umfangreiche Literaturrecherche wurde mit Hilfe der Web of Science-Datenbank durchgeführt, um relevante Studien und Methoden zu identifizieren, die bei der Hochwasserkartierung mit Fernerkundungsdaten eingesetzt werden. Die Leistung der einzelnen Algorithmen wird anhand der Gesamtgenauigkeit, des Kappa-Wertes und anderer Bewertungsmaßstäbe bewertet. Ein umfassender Datensatz, der Sentinel-1-Daten sowie Relief- und Hydrologiemetriken enthält, wird für das Training und die Validierung des Modells verwendet. Die Ergebnisse zeigen, dass der Random-Forest-Algorithmus die Schwellenwertmethoden übertrifft, mit höherer Genauigkeit und verbesserten Fähigkeiten zur Hochwassererkennung. Diese Arbeit liefert wertvolle Einblicke in die Anwendbarkeit verschiedener Algorithmen zur Hochwasserkartierung unter Verwendung von Sentinel-1-Daten und bietet Empfehlungen für die Auswahl geeigneter Methoden für bestimmte Hochwasserszenarien. Die Ergebnisse tragen zum wachsenden Wissensstand über die Hochwasserkartierung mithilfe von Fernerkundungsdaten bei und unterstützen Entscheidungsträger bei der Katastrophenbewältigung und der Planung der Schadensbegrenzung.
Evaluation der Kompentenz zur Identifikation von Deep Fake-Satellitenbildern
Studiengang
Bachelor Geodäsie und Geoinformation
Verteidigungsdatum
21.04.2023
Betreuer
Christine Wessollek, Lucas Kugler
Zusammenfassung
Satellitenbilder sind ein wesentlicher Bestandteil bei der täglichen Überwachung der Erde. Aus den resultierenden immensen Datenmengen lassen sich Analysen durchführen, um beispielsweise die Umwelt der Erde tiefgründig verstehen zu können. Auch in der Gesellschaft nehmen Satellitendaten mittlerweile eine Schlüsselrolle ein. Jedermann hat heutzutage Zugriff auf Satellitenbilder über entsprechende Kartendienste seines Smartphones. Doch besonders in der Sicherheitspolitik werden Satellitenbilder genutzt, um Konflikt- und Kriegszonen zu überwachen. Zusätzlich sind Satellitenbilder eine unabhängige Informationsquelle aus der Vogelperspektive, die eine Entscheidungsfindung bei sicherheitspolitischen Fragestellungen vorantreiben kann. Insbesondere durch die ständig steigenden Datenmengen leisten bestimmte Deep Learning Methoden Abhilfe, um den Analyseprozess weitreichend automatisieren zu können. Schon heute gibt es zahlreiche Anwendungen von Deep Learning zur Auswertung von Satellitendaten, wie unter anderem die Objekterkennung oder die Landbedeckungsklassifizierung . Jedoch stellt die Fälschung von Satellitenbildern mithilfe generativer gegnerischer Netze (GAN) eine Kehrseite dar, die oftmals unterschätzt wird und in der aktuellen Forschungsliteratur bisher kaum untersucht wurde. Jene Fälschungen werden aufgrund ihrer Deep Learning Methoden als Deep Fakes bezeichnet. Besonders der Einfluss der rein visuellen Detektion von gefälschten Satellitenbildern und die Rolle von Fachkompetenzen bei der Detektion werden in der vorliegenden Arbeit evaluiert. Außerdem wird in der Arbeit die Problematik zur synthetischen Generierung von Satellitenbildern durch GAN aufgearbeitet. Vorerst wird der Bezug von Fernerkundung auf die Sicherheitspolitik und die Fälschung von Geodaten vorgestellt. Die theoretischen Grundlagen werden gelegt, um den bisherigen Forschungsstand und wesentliche Möglichkeiten zur synthetischen Generierung von Satellitenbildern aufzuzeigen. Anschließend werden auf Grundlage des LoveDA-Datensatzes eigene Deep Fake-Satellitenbilder durch ein DCGAN und ein FastGAN erstellt. Der Datensatz umfasst fast 6000 hochauflösende Satellitenbilder der chinesischen Städte Nanjing, Changzhou und Wuhan, die im Juli 2016 aufgenommen wurden. Dadurch kann die Anwendbarkeit der zwei GAN-Erweiterungen mit Satellitenbildern eingeschätzt werden. Während das DCGAN schwache Ergebnisse liefert und unter einem Moduszusammenbruch leidet, können durch das FastGAN vor allem deutlich authentischere und vielseitigere ländliche Bilder erzeugt werden. Die eigene Bildgenerierung zielt darauf ab, die visuelle Detektion von gefälschten Satellitenbildern mithilfe einer Online-Umfrage zu evaluieren. Dabei wird zusätzlich untersucht, ob Fachkompetenzen das Detektionsergebnis beeinflussen. Anhand der Ergebnisse werden die Herausforderungen bei der rein visuellen Überprüfung deutlich. Die Teilnehmenden, die überwiegend aus der Generation Z stammen, sind nicht in der Lage, die Fälschungen sicher zu erkennen. Insbesondere die hohe Anzahl der fälschlicherweise als echt eingestuften Deep Fakes sind als problematisch zu betrachten. Auch können die als fachkompetent eingestuften Probanden keine bessere Detektionsrate erreichen. Somit beeinflussen Fachkompetenzen unter den vorliegenden Umfragebedingungen das Detektionsergebnis nicht. Die Auswertung der Selbsteinschätzung zeigt auf, dass es überwiegend eine Diskrepanz zwischen tatsächlichem Detektionsergebnis und eigener Einschätzung gibt. Jedoch wird mit dem eigenen Detektionsansatz gezeigt, dass aus technischer Sicht die sichere Erkennung der eigenen Deep Fake-Satellitenbilder möglich ist. Mithilfe einer Support Vector Machine (SVM) und 26 Indizes, die den räumlichen Bereich, den Frequenzbereich und das Histogramm eines Bildes betrachten, kann ein leistungsstarker F1-Wert von 0,99 erreicht werden. Daraus lässt sich schlussfolgern, dass die SVM deutlich effektiver Fälschungen erkennen kann als die Umfrageteilnehmer. Schlussendlich wurden erste Erkenntnisse zur Einschätzung der Deep Fake-Problematik und zur Detektion der Fälschungen aufgezeigt. Einige Ansätze für weiterführende Forschungen wurden vorgestellt, um beispielsweise die Problematik speziell für Sicherheitspolitiker beurteilen zu können.
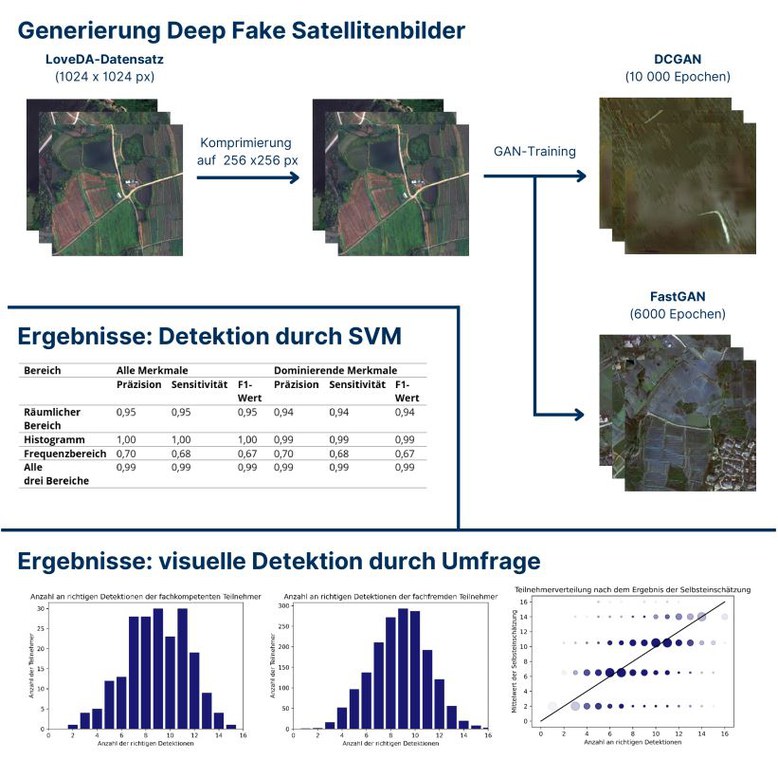
Graphische Zusammenfassung
Waldbrände in der Böhmisch-Sächsischen Schweiz 2022: Kartierung und Analyse von Brennstofftypen, Feuer-Dynamik und -Schwere mit Fernerkundungsdaten
Studiengang
MSc Geoinformationstechnologien
Verteidigungsdatum
23.03.2023
Betreuer
Matthias Forkel, Dr. Annika Busse (Nationalpark Sächsische Schweiz)
Zusammenfassung
Die Waldbrände in der Böhmisch-Sächsischen Schweiz im Sommer 2022 zeigten die Notwendigkeit, den Brand, die Brandschwere und die zugrundeliegenden Brennstofftypen genauer zu untersuchen, um zum Schutz vor Waldbränden vor allem in Deutschland und Mitteleuropa beizutragen. Deshalb wurden in dieser Arbeit die verschiedenen Brennstofftypen (Fuel types) in beiden Nationalparks und umliegenden Schutzgebieten kartiert und analysiert. Die Fuel type Klassifikationen von Aragoneses et al. (2022) und der Alaska Fuel Model Guide Task Group (2018) wurden für die Klassifikation im Untersuchungsgebiet kombiniert und angepasst. Unter anderem wurden Habitats-Daten beider Nationalparks, die Vegetationsbedeckung von Copernicus und Daten von Borkenkäfer-befallenen Wäldern genutzt. Ein Schwerpunkt wurde unter anderem auf das Totholz in beiden Nationalparks gelegt, welches auf intensiven Borkenkäferbefall der letzten Jahre zurückzuführen ist und die Mehrheit der verbrannten Fläche darstellt (41%). Um den Borkenkäferbefall auf beiden Seiten zu kartieren, wurde für die Böhmische Schweiz ein Random Forest Model mit Borkenkäferdaten der Sächsischen Schweiz trainiert. Außerdem wurden die Bänder eines Landsat 8 Bildes und der Normalized Burn Ratio (NBR), der Normalized Difference Moisture Index (NDMI) und der Normalized Difference Vegetation Index (NDVI) als Prädiktorvariablen genutzt, wobei das grüne Band und der NDMI den größten Einfluss auf das Modell hatten. Insgesamt wurde eine Genauigkeit von ca. 90 % erreicht. Weiterhin wurden die Brennstofftypen zu einzelnen Fuel Models von Scott and Burgan (2005) klassifiziert, um zukünftig mit der Hilfe von Feuermodellen genauere Aussagen über das Brandverhalten, die Flammenhöhe oder die Brandgeschwindigkeit treffen zu können. Die Schwere des Brandes wurde mit Fernerkundungsdaten von Landsat 8, 9 und Sentinel-2 und dem Difference Normalized Burn Index (dNBR) untersucht. Zur Berechnung des dNBR wurde die Differenz zwischen dem NBR vor dem Feuern und dem NBR nach dem Feuer gebildet. Dazu wurden Satellitenbilder von Mitte August bis Ende September 2021 und Bilder nach dem Feuer (Ende August bis Ende September 2022) genutzt. Validierungsdaten wurden durch Feldmessungen im September und Anfang Oktober 2022 mit Hilfe des Composite Burn Index (CBI) aufgenommen. Ein signifikanter Zusammenhang zwischen den beiden Indices ließ sich vor allem zwischen den mittleren und hohen Bäumen (Strata D und E) und den Fernerkundungsdaten feststellen (r = 0.62, p < 0.01). In der bodennahen Vegetationsschicht (Strata A, B und C) wurden hohe Brandschweren festgestellt, welche mittels Fernerkundungsbilder nicht ausgemacht werden konnten. Der von Satellitenbildern errechnete dNBR detektierte moderate Brandschweren über beide Nationalparks, welche in Totholzbeständen und anderen bewaldeten Brennstofftypen am höchsten war. Vor allem in den mit Borkenkäfern befallenen Fichtenwäldern wurden hohe Verkohlungen an den Baumstämmen festgestellt, welche durch die Trockenheit des Holzes begünstigt wurden.
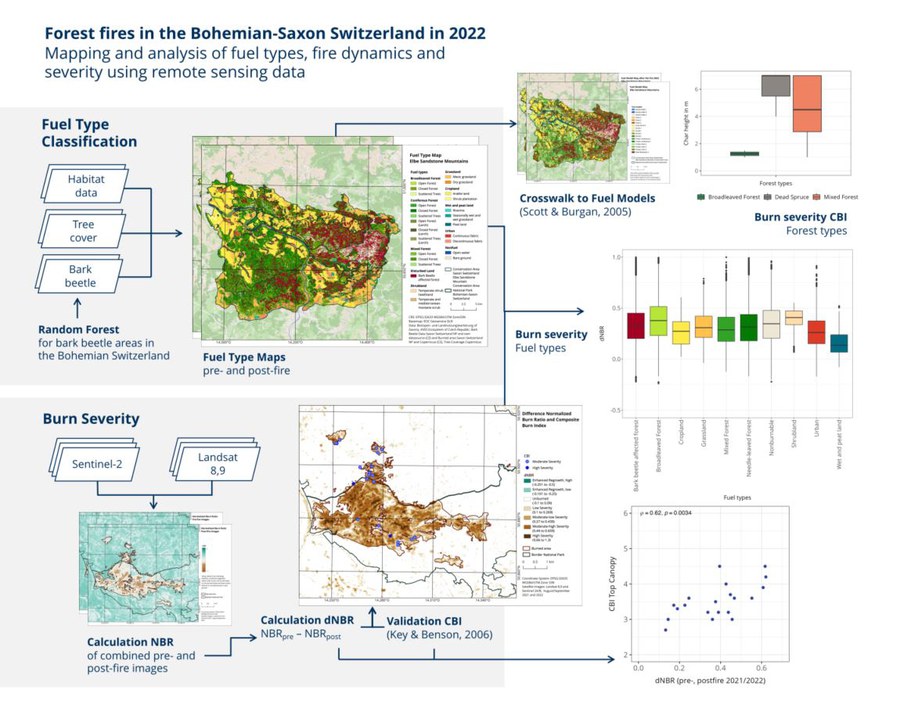
Grafische Zusammenfassung der Abschlussarbeit
Klassifikation von Feuertypen in Savannen des südlichen Afrika unter Benutzung von Sentinel-Daten
Studiengang
MSc Geodäsie
Verteidigungsdatum
20.01.2023
Betreuer
Dr. Christine Wessollek, MSc. Tichaona Tavare Mukunga (TU Wien, Department für Geodäsie und Geoinformation)
Zusammenfassung
Feuer sind ein natürlicher Bestandteil der Natur von Savannengebieten. Es wird geschätzt, dass durch diese Brände jährlich 300-1600 Teragramm Kohlenstoff (TgC) freigesetzt werden. Um diese im Hinblick auf die Art der Landbedeckung und die Schwere der Brände zu analysieren, wurde eine Methode zur Klassifizierung von ebendiesen entwickelt, die auf der Verwendung von Landbedeckungsdatensätzen und Sentinel-2-Daten basiert.
Zu diesem Zweck wurde das Landbedeckungsmodell ESA WorldCover 2020 für ein Beobachtungsgebiet in Sambia ausgewählt und mit dem ESA CCI LAND COVER - S2 prototype 2016 verglichen. Das gewählte Beobachtungsgebiet hatte eine Ausdehnung von 14,8°-15,2°S und 25,7°- 26,1°E und enthielt alle vier Hauptlandbedeckungstypen: Baumbewuchs, Strauchland, Grasland und Ackerland.
Nach der Wahl der als eine Grundlage für die Feuerklassifikation genutzten Landbedeckungsdaten, wurden die Sentinel-2-Daten mit der Verarbeitungssoftware FORCE von David Frantz von L1C zu L2A verarbeitet. Mit diesen Daten wurde die Schwere der detektierten Brände durch Berechnung des Normalized Burn Ratio Indexes umgesetzt. Zusätzlich zu der in FORCE umgesetzten atmosphärischen Korrektur der Sentinel-2-Daten wurden die Daten unter Verwendung des DEM_SRTM1-Datensatzes auch toposphärisch korrigiert. Die „Difference Normalized Burn Ratio“ (dNBR) wurde dann aus den Sentinel-2 L2A-Daten als Differenz zwischen der Normalized Burn Ratio (NBR) vor und nach den Bränden berechnet. Daraus wurde die Brandschwere als Maß für den Grad der Brandwirkung für die verbrannte Fläche nach der Methode von Key und Benson bestimmt.
Anhand der Bodenbedeckung und der Brandschwere wurden sechzehn Brandklassen definiert. Diese Brandklassen wurden anschließend qualitativ bewertet, indem die Ergebnisse mit entsprechenden Klima- und Bodenfeuchtedaten verglichen wurden. Es zeigte sich, dass der jährliche Verlauf der Brände mit den Niederschlägen und der entsprechenden Bodenfeuchte der vorangegangenen Monate verknüpft war. Darüber hinaus wurden die Beziehungen zwischen diesen Brandklassen und der Feuerstrahlungsleistung (Fire Radiative Power, FRP) analysiert. Zu diesem Zweck wurden die VIIRS 375m FRP-Daten mit den einzelnen Brandklassen für jedes Jahr verglichen. Aus den Daten wurde ersichtlich, dass ein höherer Schweregrad bei den klassifizierten Bränden mit höheren FRP-Werten einhergeht.
Insgesamt wurde eine Klassifizierung der erkannten Brände vorgenommen, deren Ergebnisse mit den verfügbaren Wetter- und Bodenfeuchtedaten übereinstimmen. Außerdem konnte eine Korrelation zwischen den verschiedenen Brandklassen und dem gemessenen FRP-Wert festgestellt werden.
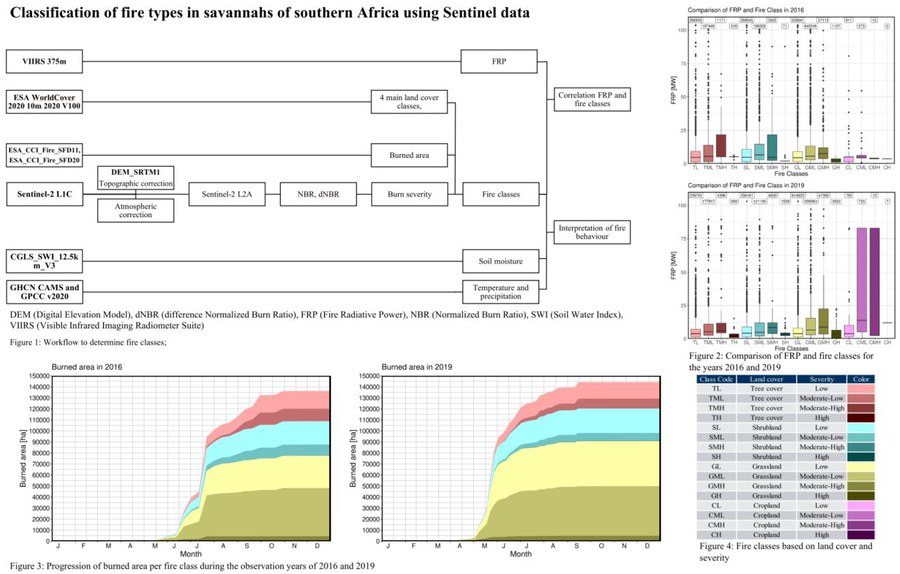
Grafische Zusammenfassung der Abschlussarbeit
Vergleich des deutschen Waldbrandgefahrenindex und von mittel-aufgelösten Satellitenprodukten für die Quantifizierung des Auftretens von Waldbränden in Mitteleuropa
Studiengang
MSc Geoinformationstechnologien
Verteidigungsdatum
13.01.2023
Betreuer
Matthias Forkel, Dr. Dirk Pflugmacher (Humboldt-Universität zu Berlin), Christopher Marrs
Zusammenfassung
In dieser Studie wurde der deutsche Waldbrandgefahrenindex (WBI) untersucht und verglichen mit zwei Random Forest (RF) Modellen, welche die Wahrscheinlichkeit, dass Waldbrände auftreten (oder nicht), erkennen sollen. Diese Modelle wurden mit Fernerkundungsdaten trainiert, sowie mit der Information von schon stattgefunden Feuerereignissen aus dem Jahr 2020. Die Fernerkundungsdaten, die für diese Analyse genutzt wurden, sind: Blattflächenindex (LAI), Landoberflächentemperatur (LST), Bodenfeuchte (SSM), Bodenwasserindex (SWI) als auch weitere statische räumliche Daten über die Waldarten, die Baumhöhe, die Hangneigung, die Ausrichtung des Hanges, der Tag des Jahres, an dem das Feuer 2020 stattgefunden hat, sowie die Bevölkerungsdichte. Das erste Model bezieht sich nur auf die Variablen, die mit dem WBI verlinkt sind, um so eine direktere Vergleichbarkeit zu kreieren. Das zweite Model inkludiert auch Parameter, die Aussagen über den Feuerausbruchsmoment liefern. Die Evaluierung des WBI wurde mit Information über schon stattgefundene Feuer, sowie detaillierte Informationen dieser Feuer, wie der Größe der verbrannten Erde, der Landbedeckung und den Gründen warum es zu dem Feuerausbruch gekommen ist, durchgeführt. Diese Informationen zeigen, dass der WBI, nicht wie angenommen an stattgefunden Feuern die höchste Warnstufe aufweist, vielmehr befindet sich dieser im mittleren Bereich. Des Weiteren haben die WBI-Gefahrenklassen keine distinkten Werte in den Satellitenvariablen vorzuweisen, was bedeutet, dass die Warnstufen nicht konsistent und vor allem nicht klar voneinander abgrenzbar sind. Die Ergebnisse der RF-Modelle, welche Information über die Feuergefahr liefern, haben eine Modelgenauigkeit von 0.67 und 0.71, was als gut bewertet werden kann.
Colouring and interactive visualization of historical Earth observation data
Studiengang
MSc Cartography
Verteidigungsdatum
23.09.2022
Betreuer
Matthias Forkel, Mathias Gröbe, Lucas Kugler
Zusammenfassung
In the 1960s, the US launched a series of satellite projects aimed at building a reconnaissance system. The CORONA project was in operation between 1960 and 1972. During the operation, a large number of satellite images were taken. Until 1995, these images remained classified. Since 1995 numerous researchers have exploited the CORONA images, primarily to study surface cover changes across the globe. This study adapts the existing DeOldify model, which is dedicated to colourising images to specifically colourise CORONA satellite images through retraining the model using the CORONA image dataset. The CORONA image dataset consists of greyscale CORONA images and colour reference images covering the same region and having little or no change in the image content. A generative adversarial network is used for building this model. A U-Net-based generator network and a binary-classifier-based critic network train in an alternative approach. To improve the training efficiency, transfer learning and NoGAN training techniques are implemented. The generated images are evaluated both quantitatively, using RMSE and PSNR, and qualitatively, using a user study asking the participant if the displayed colour image looks natural. Results show that generated images with good performance using RMSE and PSNR do not necessarily have plausible colours. Compared with the original DeOldify model, the retained model can produce images with more natural and plausible colours, achieving a result of 70.1% of the participants thinking they are real, although these images have poorer reconstructing quality. To visualise the results, a web mapping application is developed with Geoserver and Leaflet. The server stores data and publishes it through WMTS or WFS. Cache service and image pyramid are used to accelerate the response on the client side. The web map client provides an interactive map interface for the users to control the displayed layers and download the selected layer in a self-defined ROI through WPS.
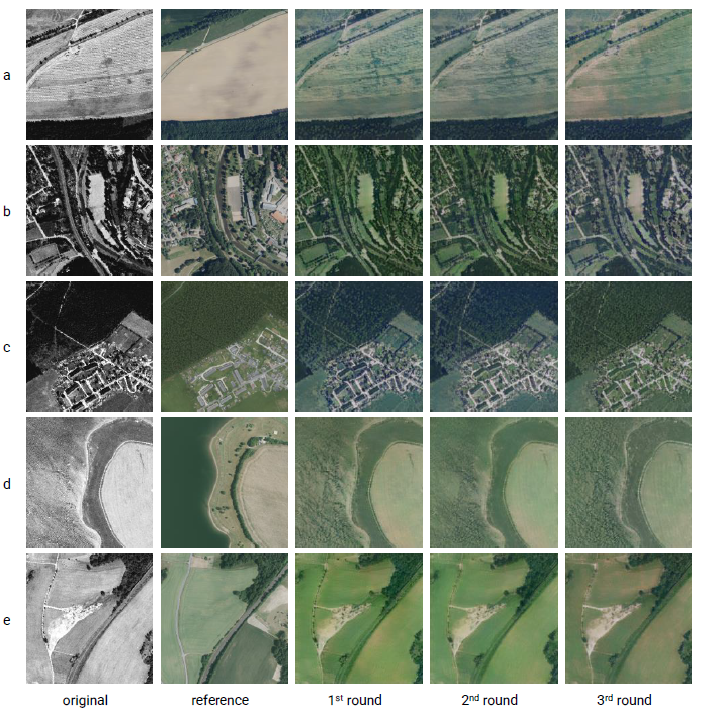
Ausgewählte Samples aus jeder Runde des NoGAN-Trainings
Differentiation of Calluna vulgaris in seed germination and stock sprouting in the Kyritz-Ruppiner Heide in relation with maintenance activities
Studiengang
MSc Raumentwicklung und Naturressourcenmanagement
Verteidigungsdatum
14.04.2022
Betreuer
Matthias Forkel, Dr. Carsten Neumann (GFZ Potsdam)
Zusammenfassung
Der Verlust der Biodiversität zeigt sich in vielen Bereichen, wird immer sichtbarer und hat viele Gesichter, dabei spielt der Einfluss des Menschen eine signifikante Rolle. Durch immense Landnutzungsänderungen gestaltet der Mensch den Planeten um. Dieser Einfluss trägt ebenfalls zum Erhalt und zur Erschaffung neuer Ökosysteme bei. Die Heidelandschaften sind ein Beispiel für das (un)bewusste Wirken des Menschen, da dieser Lebensraum durch die traditionelle Bewirtschaftung des Menschen entstand und geformt wurde. Allerdings ist mittlerweile auch dieser Lebensraum bedroht, da die traditionelle Landwirtschaft der industriellen gewichen ist und sich in der Folge die Techniken der Bewirtschaftung geändert haben. Gerade diese sorgten für die Widerstandsfähigkeit und damit den Erhalt des Lebensraumes. Mittlerweile sind viele der Heideflächen überaltert und in einem schlechten bis sehr schlechten Zustand. Der FHH-Bericht von 2019 besagt zusätzlich, dass der Zustand sich weiter verschlechtern wird, (BFN, 2019). Der Erhalt dieser Lebensräume ist somit auf die Pflege des Menschen angewiesen.
Die Förderung von Pflegemaßnahmen zur Verjüngung der Heidebestände ist essenziell, um eine bessere Strukturierung und somit Resilienz des gesamten Lebensraumes aufzubauen. Hierbei ist die Unterscheidung in Samenkeimung und Wiederaustrieb relevant (Watt, 1955; Whittaker & Gimingham, 1962; Miller & Miles, 1970; Webb, 1986).
Zur Unterscheidung diese Vegetationsarten wurde die Hypothese aufgestellt, dass es Unterschiede im Wachstum sowie der Ausbildung der Blüten bestehen.
Um diese These zu validieren, wurden in der Kyritz-Ruppiner Heide Flächen durch Abbrennen und Mähen gepflegt. Mittels regelmäßiger Drohnenaufnahmen wurde der Wiederaustrieb erfasst, welche als Datengrundlage für diese Arbeit dienen. Durch die Verwendung von verschiedenen Indizes fand eine Klassifizierung der Heideindividuen statt, welche Rückschlüsse auf die Variablen: Flächengröße, Wachstumsunterschied sowie Blütenbildung ergaben. Aufgrund der Annahme, dass Calluna Keimlinge ein geringeres Wachstum besitzen als Wiederaustrieb, ist mit Unterschieden in der Flächengrößen sowie der Wachstumshöhe auszugehen. Aufgrund dieser Dynamik kann ebenfalls von einer spätere sowie kürzeren einsetzenden Blühperiode ausgegangen werden. Mittels Schrittweiser Anpassung der Variablen sowie anschließender Datenanalyse konnten Schwellenwerte in der Wachstumsdynamik erkannt werden. Zusätzlich wurden Verbindungen zwischen Blühperioden, Wachstumsperioden und Pflegemaßnahmen erkannt.
Durch Menschen geschaffene Naturflächen entwickeln sich durch und mit dem Einfluss des Menschen. Um die Biodiversität dieser Lebensräume zu schützen und zu erhalten, benötigt es auch diverse Maßnahmen.
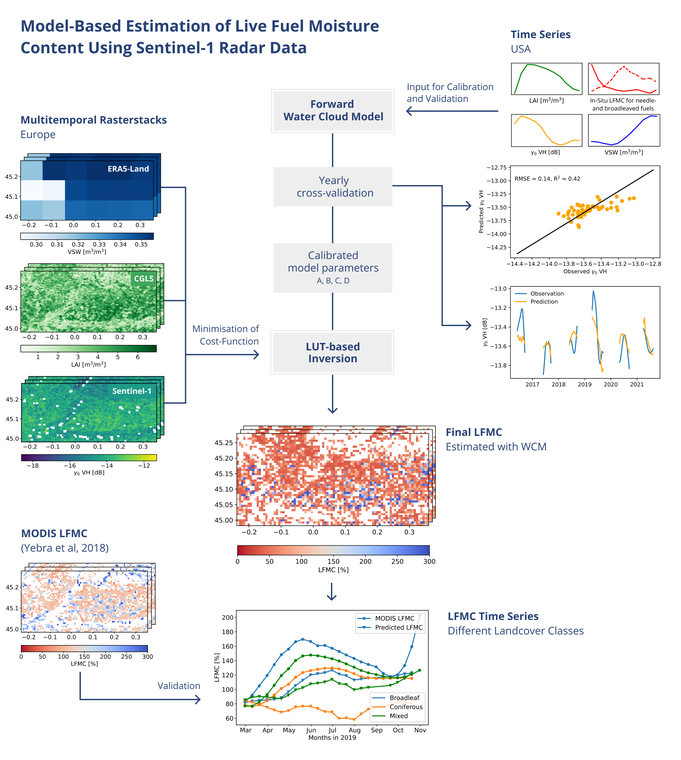
Modellgestützte Abschätzung des Lebendbrennstoffwassergehalts mit Sentinel-1 Radardaten
Studiengang
MSc Geoinformationstechnologien
Verteidigungsdatum
04.04.2022
Betreuer
Matthias Forkel, Dipl.-Ing. Ruxandra-Maria Zotta (TU Wien, Department für Geodäsie und Geoinformation)
Zusammenfassung
Aufgrund des fortschreitenden Klimawandels ist die Abschätzung von Waldbrandgefahren weltweit von großer Bedeutung. Ein wichtiger Indikator ist der Wassergehalt von lebenden Brennstoffen (Live fuel moisture content, LFMC), definiert als das Verhältnis zwischen dem Pflanzenwassergehalt und der trockenen Biomasse, da ein erhöhter LFMC die Wahrscheinlichkeit einer Brandentstehung und die Geschwindigkeit der Brandausbreitung senkt. In einer Vielzahl von Studien wird das Potential von optischen Satellitendaten zur Abschätzung des LFMC auf regionaler und globaler Ebene aufgewiesen. Da die Nutzung optischer Sensoren jedoch aufgrund atmosphärischer Einflüsse und mögliche Wolkenbedeckung eingeschränkt ist, bieten Mikrowellensatellitendaten eine Alternative. Diese Arbeit konzentriert sich auf das Potential von Sentinel-1 Radardaten für die Bestimmung von LFMC, indem der Ansatz von Wang et al. (2019), der das Water-Cloud-Modell (WCM) und ein lineares Modell für die Bodenrückstrahlung kombiniert, weiterentwickelt wird. Der genannte Ansatz beachtet nicht, dass die Radarrückstrahlung durch Veränderungen in Biomasse, Vegetationsstruktur und Bodenfeuchte beeinflusst werden kann. Infolgedessen wurden biophysikalische Variablen für Vegetation und bodenbezogene Parameter als zusätzliche Eingabedaten in das WCM eingeführt und deren Beitrag zur Genauigkeit des WCM bewertet. Das Modell wurde zunächst mit verfügbaren In-situ-Messungen für Untersuchungsgebiete in den Vereinigten Staaten von Amerika (USA) trainiert und validiert und anschließend auf Waldstandorte in Europa übertragen, an denen keine LFMC-Messungen existieren.
Unter Verwendung der zusätzlichen Variablen, LFMC-Bodenmessungen, Blattflächenindex (Leaf area index, LAI) und volumetrischer Wassergehalt des Bodens (Volumetric soil water, VSW), ermöglichte das modifizierte WCM, die Anteile von Boden und Vegetation an der gesamten Radarrückstrahlung akkurat zu simulieren. Im Vergleich zu VSW beeinflusste der LAI die Performanz des Modells während der Kalibrierung stärker. Um das Modell für die Abschätzung von LFMC zu invertieren, wurde eine optimierte Look-up-Tabelle (LUT) entwickelt, indem das WCM unter Verwendung aller möglichen Kombinationen eines zuvor festgelegten Wertebereichs für die Variablen eine Vielzahl von Rückstrahlungswerten simulierte. Die Einbeziehung von LAI und VSW in die Kostenminimierung zur Suche innerhalb der LUT ermöglichte den Transfer des WCM nach Europa, da die Modellgenauigkeit vorrangig von den Beziehungen zwischen Radarrückstrahlung, LAI, LFMC und VSW abhängt. Diese Beziehungen variieren abhängig von der Heterogenität vorkommender Vegetationsarten und dem Anteil der Vegetationsbedeckung. Die abgeleiteten LFMC-Werte wurden in die Klassen Nadel-, Laub- und Mischwald eingeteilt und anschließend mit dem MODIS LFMC-Produkt validiert, das auf dem Algorithmus von Yebra et al. (2018) basiert. Für Laub- und Mischwälder wurden vielversprechende Werte für den Root Mean Square Error (RMSE = 25 %, 26%) und den Determinationskoeffizient (R2 = 0.50, 0.42) erzielt, während das WCM bei Nadelwäldern zu höheren Ungenauigkeiten führte (RMSE = 45 %, R2 = 0.17).
Predicting spatial patterns of forest fire using random forest machine learning algorithm in the Terai Arc Landscape of Nepal
Studiengang
MSc Tropical Forestry and Management
Verteidigungsdatum
14.01.2022
Betreuer
Matthias Forkel, Mir A. Matin
Zusammenfassung
Increasing forest fire events present novel challenges to forest ecosystems and human well-being. Early detection of forest fire and understanding interrelationship between forest fire and forest fire driving factors are considered important for effective fire management. To understand the perception of decision makers on existing fire management infrastructure and initiatives is equally important in order to implement preventive measures. We used VIIRS fire dataset (2012-2021), climatic, topographic, and infrastructure predictor variables aggregated over time to generate a fire susceptibility map from random forest machine learning algorithm. Key-informant questionnaire survey was also done with the forestry professionals working in the TAL region to understand their perception on existing fire management initiatives. RF model achieved an overall accuracy of 72.8% and a sensitivity value of 88% in the evaluation dataset indicating a good predictive ability of fire occurrence. Most parts of the TAL region were susceptible to fire. Our findings of increased fire risk in some districts located at the south-west and north-east part of the TAL were unique to the findings of previous fire-related studies in TAL. Fire occurrence was lowest in 2020 (0.42%) followed by sharp increase in 2021 (19%). Broad-leaved forests were highly susceptible to fire. Increased number of fire events were observed with high temperatures. Fire events were higher in proximity to road and settlement. Respondents were of the opinion that there is a need for effective management initiatives to improve existing quality and condition of fuel management infrastructure and fire management initiatives. These findings will assist in in the effective decision-making process of fire prevention and suppression reducing the potential future damage due to forest fire in the TAL region of Nepal.
Bewertung von Deep Learning Modellen für die Klassifizierung der Landbedeckung unter Verwendung historischer CORONA-Satellitenbilder
Studiengang
MSc Geodäsie
Verteidigungsdatum
05.01.2022
Betreuer
Matthias Forkel, Philipp Körner
Zusammenfassung
Das Klima wird stark von den Eigenschaften der Landbedeckung geprägt, denn dort stehen Wasser, Energie und Spurengase in direkter Interaktion mit der Atmosphäre. Es ist
daher nicht verwunderlich, dass eine Veränderung der Landbedeckung auch eine Veränderung des lokalen Klimas und der Stoffkreisläufe hervorruft. Die Fernerkundung hat spätestens mit dem Start des Landsat-Satellitenprogrammes (1972) einen fundamentalen Anteil an der kontinuierlichen Erdbeobachtung und der Erfassung des Landbedeckungswandels. Im Jahr 1995 veröffentlichte der Geheimdienst der Vereinigten Staaten von Amerika bis dahin geheime Spionage-Satellitenaufnahmen. Bei diesen Aufnahmen handelt es sich um ab 1960 entstandene pan-chromatischen Satellitenaufnahmen mit einer nahezu globalen Abdeckung. Die Satellitenbilder sind besonders interessant, weil sie Informationen über die Landbedeckung 10 Jahre vor Beginn der zivilen Erdbeobachtung beinhalten. Dennoch sind sie eine bis heute kaum untersuchte Datenquelle.
Die vorliegende Arbeit untersucht aufbauend auf ersten Ansätzen, verschiedene neuronale Netze anzuwenden um die Landbedeckung automatisiert aus CORONA-Daten zu extrahieren. Der besondere Fokus der Arbeit liegt auf der Übertragbarkeit der Ansätze auf unbekannte CORONA-Daten. Langfristig soll großflächig die Landschaftsbedeckung aus CORONA-Daten extrahiert werden. Zur Untersuchung der Übertragbarkeit wurden sieben räumlich und zeitlich verteilte Testgebiete im Freistaat Sachsen für eine Kreuzvalidierung ausgewählt.
In der vorliegenden Studie wurden insgesamt vier verschiedene U-Net Architekturen verwendet. Ein U-Net ist ein tiefes neuronales Netz zur semantischen Segmentierung von
Bilddaten. Alle vier Architekturen besitzen unterschiedliche Fähigkeiten und sind für verschiedene Herausforderungen der Klassifikation der Landbedeckung optimiert. Als Eingabe diesen drei verschiedene Bildkompositionen. Zum ersten die originalen Pixelwerte (ein Kanal), zum Zweiten die GLCM-Texturmaße (zehn Kanäle). Die dritte Komposition ist ein simuliertes RGB-Bild (drei Kanäle). Diese drei Kompositionen wurden zu in einem Bild mit 14 Kanälen kombiniert. Zusätzlich wurden für alle Testgebiete semantische Masken erstellt welche als Referenzdaten dienen. Dazu wurde die Landschaftsbedeckung in sechs Klassen unterteilt. Aus diesen Eingabedaten wurden sieben unterschiedliche Trainingsdatensätze und Testdatensätze für die Kreuzvalidierung abgeleitet.
Aufbauend auf den Trainingsdatensätzen wurden jeweils vier Architekturen für jedes
Testgebiet trainiert und anschließend auf die entsprechenden Testdaten angewandt. Aus den Ergebnissen des Trainings konnte zunächst ableitet werden, dass eine Klassifikation der Landbedeckung aus CORONA-Daten mit den verwendeten Architekturen möglich
ist. In allen Testgebieten haben alle Architekturen einen Trainings-IOU von über 85% erreicht. Für die einzelnen Testgebiete wurden schlechte bis mittlere IOU-Werte erreicht.
Die beste mittlere Segmentierungsgenauigkeit liegt bei 30,50%, der schlechteste Wert für
ein Testgebiet liegt bei 12,71%. Unter den Klassen wurden starke Genauigkeitsschwankungen erkannt. Klassen die mit vielen Beispieldaten erreichen signifikant bessere IOU-Werte als unterrepräsentierte Klassen. Die beste Segmentierungsleitung wurde mit einem durchschnittlichen IOU von 54,51% wurde für die Klasse landwirtschaftliche Flächen erreicht, dicht gefolgt von Wald mit 52,80%. Für die Klassen Strauchvegetation, offene Flächen und Gewässer wurden überwiegend nur IOU-Werte von unter 10% erreicht. Für Klassen mit vielen Beispieldaten konnte eine mittlere bis gute Segmentierungsgenauigkeit sowohl für die räumliche als auch zeitliche Übertragbarkeit erreicht werden. Da der Datensatz nicht alle Faktoren für eine generalisierte Übertragbarkeit abdeckt konnte die Übertragbarkeit nur unter gewissen Rahmenbedingen sichergestellt werden. Die Studie deckt beispielsweise keinen Umgang mit Wolken oder CORONA-Daten von schlechter Qualität ab.
Aus den Ergebnissen wurde erkannt, dass eine Kombination der Ergebnisse von verschiedenen Architekturen womöglich die Ergebnisse verbessert. Daraus resultierend wurde empfohlen diesen Sachverhalt für weitere Entwicklungen zu berücksichtigen.
Assessing the Spatial Variability of Aboveground Forest Carbon using Sentinel-1, Sentinel-2 and Field Inventory Data of the Miombo Woodlands in Songwe District, Tanzania.
Study
MSc Tropical Forestry
Date of defence
2021-11-29
Supervisor
Matthias Forkel, Hamidu Seki ( University of Dar es Salaam - Mkwawa University College of Education, Tanzania)
Abstract
Accurate estimates of aboveground biomass and carbon (AGC) are needed to understand the role of forests in the global carbon cycle. To achieve this, recent forest monitoring and assessment techniques now rely on integrating remote sensing and field inventory data to map and monitor carbon changes in tropical forests. More importantly, AGC spatial distribution is intricately linked to climate, soil, topography, and anthropogenic disturbances, whose influences should be understood so that their spatial effects are utilized to sustain forest carbon. Hence, this study combined Sentinel-1 and Sentinel-2 variables with field inventory data in a generalized additive model (GAM) to map the Tanzanian miombo AGC while explaining its spatial variability. Fifteen (15) models were trained and tested using the leave-one-out cross-validation in GAM. Model 6, containing selected predictors – B11 (Shortwave Infrared 1), NDVI (normalized difference vegetation index) and tree canopy cover (%tcc), indicated best prediction accuracy (R2 = 0.87) with the least error (RMSE = 5.24 tC/ha) and an upper bound prediction of 114.87 tC/ha. A combination of Sentinel-2 variables (B11 & NDVI) and %tcc are better predictors for mapping AGC in the study area. Overall, the spatial drivers explained 65.5 % of AGC spatial variability with elevation having the highest predictive power (21.65 %), followed by mean annual temperature (MAT; 21.10 %), the interaction effect of elevation and distance to settlement (20.99 %), distance to settlement (18.24 %) and silt content (18.02 %). The study also showed that AGC increases with increasing elevations and silt content and decreases with increasing MAT and distance to settlement. More so, AGC increases accordingly with increasing interaction effect between elevation and distance to settlement. Therefore, understanding the impact of these factors on the distribution of AGC will be necessary for adequate forest planning and management.
Predicting, understanding, and visualizing fire dynamics with neural networks
Study
MSc Cartography
Date of defence
2021-11-22
Supervisor
Matthias Forkel, Tichaona Tavare Mukunga MSc. (TU Wien)
Abstract
As machine learning techniques are contributing to scientific research and advancement, the interpretability and visualization of these algorithms grow in importance. These techniques have introduced many improvements to advance our understanding of fire regime dynamics outperforming process-based approaches. Neural networks have achieved great accuracy with fire modeling, however, challenges arise with unbalanced time series. In this thesis, LSTM neural networks, which are designed for sequence modeling and handling unbalanced data, are investigated to explore their ability to predict fire ignition points. The research is conducted for a small area in western Africa using monthly meteorological variables and fAPAR as an indicator for vegetation for a period spanning from 2003 to 2016. The chosen methodology is based on training one LSTM for each pixel independently. Datasets are pre-processed, structured as a multivariate time series and then arranged to fit LSTM 3D data format. The network architecture was chosen by conducting multiple experiments. The pixel-based LSTM was able to capture the seasonal and spatial varieties with RMSE value computed at 3.333. However, it underestimated the high values of ignitions during the peak of fire season and was not able to record sudden events. To better understand LSTM behavior, multiple interpretation techniques were investigated to evaluate their abilities to determine the most important features and visualize their dependencies. Permutation feature importance gave an overview of overall feature importance while variance-based feature importance was able to map the spatial distribution of each feature. SHAP summary plots gave a detailed interpretation of feature importance of precedent time steps. The most important features to predict fire ignitions were found to be fAPAR, precipitation and maximum temperature. Recent conditions were found more important north of the study area, whereas, in the middle and southern regions, precedent year conditions were of higher importance. SHAP dependence plots were able to depict feature-output relationships. Using these plots, it was observed that LSTM represented the fire-predictor relationship correctly only for a few variables. For feature interactions, a 3D extension of SHAP dependence plot with added color visual variable was found to be the best visualization technique. Visualization of LSTM helped with understanding how the model is learning and which variables were modeled correctly. From here, further improvements could be applied leading to increasing trust in machine learning approaches.
Erhöhung der Klassifizierungsgenauigkeit von Baumarten in Sentinel-2-Daten durch besser informierte Merkmalsauswahl
Studiengang
MSc Geoinformationstechnologien
Verteidigungsdatum
15.10.2021
Betreuer
Matthias Forkel, Dzhaner Emin (iABG mbH)
Zusammenfassung
Für die nachhaltige Forstwirtschaft und den Naturschutz spielt die Baumartenzusammensetzung von Wäldern eine zentrale Rolle. Mithilfe von multispektralen Fernerkundungsdaten und Methoden des maschinellen Lernens lassen sich Baumarten objektiv und flächendeckend gut klassifizieren, wie bisherige Studien zeigten. Das Ziel der vorliegenden Masterarbeit besteht darin, die Klassifikationsgenauigkeit für Baumarten basierend auf Sentinel-2 Daten mithilfe einer informierten Merkmalsauswahl zu steigern. Als Grundlage für die Klassifizierung dienen Inventurdaten Thüringens, weshalb sich das Untersuchungsgebiet in Westthüringen befindet und die fünf dort häufigsten Baumarten klassifiziert werden. Zur Erhöhung der Klassifizierungsgenauigkeiten der Baumarten werden deren Spektralverhalten, Phänologie und Topographie in die Klassifikation einbezogen. Hierfür erfolgte zunächst eine Vorprozessierung der Sentinel-2-Szenen mit der freien Prozessierungssoftware FORCE und die anschließende Ableitung der spektralen und phänologischen Merkmale aus der Sentinel-2-Zeitreihe sowie der topographischen Merkmale aus dem SRTM-DEM. Anhand dieser wurde anschließend eine explorative Datenanalyse durchgeführt, um die Beziehungen zwischen den Baumarten und deren artspezifischen Eigenschaften besser zu verstehen und daraus Erkenntnisse für deren Klassifizierung zu gewinnen. Abschließend wurden die Baumarten in verschieden „Random Forest“-Modellen mit deren spektralen, phänologischen und topographischen Merkmalen klassifiziert und anhand des „Mean Decrease Gini“ die Wichtigkeit dieser Merkmale für deren Unterscheidung ermittelt. Die Untersuchungen zeigen, dass die Integration der phänologischen und topographischen Merkmale die Klassifikationsgenauigkeit um rund fünf Prozent auf 90 Prozent steigern konnte. Zu den wichtigsten Eingabemerkmalen zählen die phänologischen Merkmale des Vegetationsperiodenbeginns und -höhepunkts sowie die Höhenlage und die Spektralbänder des SWIR. Durch die Anwendung eines „zweiten Mehrheitsvotums“ über die verschiedenen Ausprägungen der spektralen Merkmale konnte die Klassifikationsgenauigkeit sogar zusätzlich einige Prozent gesteigert werden. Der entwickelte Workflow zur Baumartenklassifizierung und die gewonnenen Erkenntnisse sollen zukünftigen Baumartenklassifikationen als Inspiration dienen und dabei helfen die Baumarteneigenschaften besser zu verstehen.
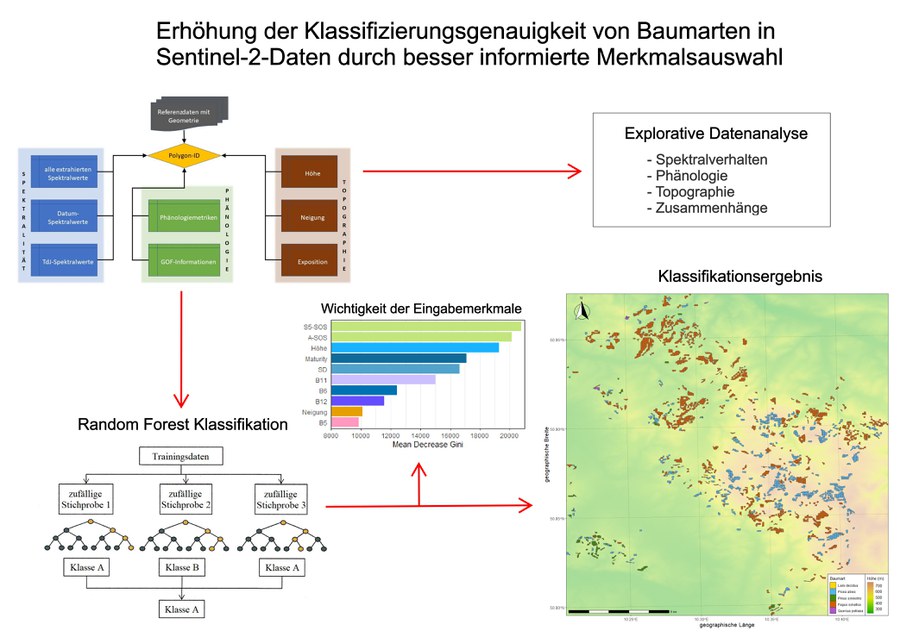
Graphische Zusammenfassung
Evaluierung der Tatsächlichen Landnutzung in ATKIS mit digitalen Orthophotos und Convolutional Neural Networks
Studiengang
MSc Geoinformationstechnologien
Verteidigungsdatum
08.10.2021
Betreuer
Matthias Forkel, Gotthard Meinel (Leibnitz-Institut für ökologische Raumentwicklung)
Zusammenfassung
Das ATKIS-Basis-DLM ist eine der wichtigsten Grundlagen in Deutschland hinsichtlich der Modellierung der Erdoberfläche. Auf Basis des Attributs „Tatsächliche Nutzung“ werden im IÖR-Monitor des Leibniz-Instituts für ökologische Raumentwicklung zahlreiche Nachhaltigkeitsindikatoren berechnet. Zur Verlässlichkeit der Tatsächlichen Nutzung gibt es bis heute jedoch keine belastbaren Angaben.
Ziel dieser Arbeit war es daher, die Qualität der Erfassung der Tatsächlichen Nutzung in ATKIS zu bestimmen. In Hinblick auf eine mögliche Automatisierung der Prüfung wurde parallel dazu getestet, ob und inwieweit Verfahren des maschinellen Lernens dazu geeignet sind, diese Aufgabe zu übernehmen. Dafür wurde ein künstliches neuronales Netz programmiert, dass auf Basis hochauflösender Ortholuftbilder die Tatsächliche Nutzung bestimmen soll.
Ausgangsbasis der Untersuchungen war eine händische Klassifikation der Tatsächlichen Nutzung in einer zufällig ausgewählten Stichprobe von jeweils 1.000 Luftbildern aus den Jahren 2012 und 2019. Die Grundauswahl der Stichprobe erfolgte dabei auf Basis von vier verschiedenen Nutzungsarten aus den Kategorien Freiraum und Siedlung. Mit der händisch erstellten sicheren Referenz wurden sowohl ATKIS als auch das neuronale Netz verglichen. Dabei konnte festgestellt werden, dass ATKIS in 93,98% der untersuchten Fälle die korrekte Tatsächliche Nutzung aufweist. Das neuronale Netz konnte in 93,7% der Fälle die richtige Nutzung erkennen. Die Schwachstellen der beiden Produkte sind teilweise komplementär zueinander, in Zukunft könnte daher ein kombiniertes Verfahren zur Verbesserung der Qualität der Tatsächlichen Nutzung in ATKIS entwickelt werden.
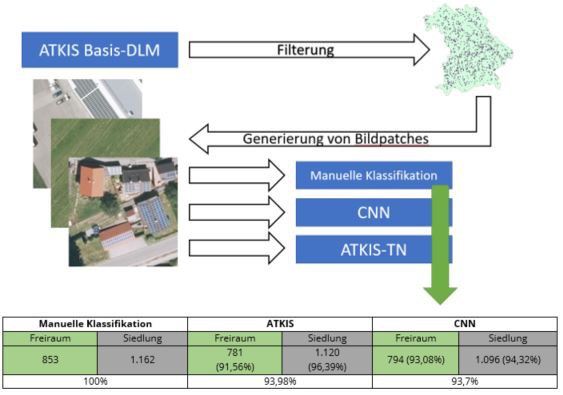
Graphische Zusammenfassung
Abschätzung der Baumhöhen in Mangrovenwäldern mit Algorithmen des maschinellen Lernens anhand kombinierter Sentinel-1 und Sentinel-2-Daten
Studiengang
MSc Geoinformationstechnologien
Verteidigungsdatum
30.09.2021
Betreuer
Matthias Forkel, Uday Pimple (King Mongkuts University of Technology, Thonburi, Thailand)
Zusammenfassung
Mangrovenwälder sind hochproduktive Ökosysteme, die außerdem Küsten und das Landesinnere vor Naturgefahren wie Tsunamis oder Wirbelstürmen schützen. Da sie auch eines der am stärksten bedrohten Ökosysteme sind, konzentrieren sich nun mehrere Projekte auf die natürliche Regeneration und Rehabilitierung ehemals zerstörter Mangrovenwälder. Mit der Analyse von Mangrovenbaumhöhen können Effektivität von Regenerations- und Rehabilitationsmaßnahmen von Mangrovenwäldern beobachtet und optimiert werden. Außerdem lässt sich so oberirdische Biomasse abschätzen als auch Gesundheitszustand und Wirksamkeit der CO 2 -Bindung von Mangrovenbäumen analysieren. Darüber hinaus kann die Baumhöhe als Maß für den Schutz vor Naturgefahren verwendet werden. Feldmessungen in Trat, Thailand, ergaben drei Transektlinien, die senkrecht zur Küste verlaufen und aus 59 10 m × 10 m-Plots bestehen, die die mittlere Baumhöhe pro Plot enthalten. Aus zwei Sentinel-2 Szenen wurden die spektralen Vegetationsindizes Normalised Difference Vegetation Index (NDVI) und Chlorophyll Vegetation Index (CVI) berechnet, sowie das Red-edge Band "B8A" für die Analyse extrahiert. Mittlere VH-Rückstreukoeffizienten von vier bei Ebbe aufgenommenen Sentinel-1 Szenen unterstützen die Sentinel-2 Variablen als unabhängige Beobachtungen für eine Random Forest Regression (RFR) und eine Support Vector Regression (SVR). Eine spezifische Einteilung in Trainings- und Testplots führte zu aussagekräftigen Validierungsergebnissen mit einem mittleren quadratischen Fehler von etwa 1.60 m und zwei Modellen, die zur Schätzung der Mangrovenbaumhöhen des Mangrovenwaldgebietes in Trat verwendet werden können. Eine Höhenverteilungskarte zeigt, dass die vertikale Strukturvielfalt entlang der Gezeitenzonen variiert. Zusätzlich gibt eine dreifache Kreuzvalidierung einen Überblick über die möglichen Genauigkeiten, die ein Modell in Abhängigkeit von der Auswahl der Trainings- und Testplots erreichen kann. Bei der Berechnung der durchschnittlichen Baumhöhe aus den Schätzungen aller drei Modelle aus jeder Faltung kann eine Karte der Standardabweichung Abschätzungsfehler aufzeigen. Insbesondere die RFR Standardabweichungen sind in der Lage, Unsicherheiten aufgrund von Wolken in einer verwendeten Sentinel-2 Szene aufzuzeigen. Ein Vergleich der Höhenverteilungskarte mit einer Artenverteilungskarte zeigt, dass Regenerationsmaßnahmen in Trat erfolgreich waren.
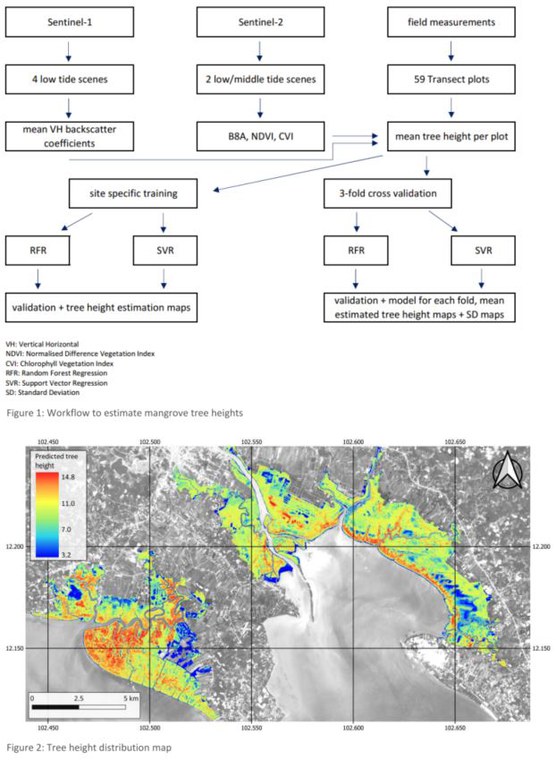
Graphische Zusammenfassung
Abschätzung hoch-aufgelöster Landoberflächentemperatur durch die Integration von Landsat-8, Sentinel-1 und Sentinel-2 mit einem Random Forest-Algorithmus
Studiengang
MSc Geodäsie
Verteidigungsdatum
20.09.2021
Betreuer
Matthias Forkel, Anette Eltner
Zusammenfassung
Landoberfächentemperaturen (LST) ermöglichen ein besseres Verständnis des Ökosystems, da sie mit dem Wasser-, Energie- und Kohlenstofffluss verknüpft sind. Einige Satelliten, ausgestattet mit thermal infrarot Bändern, liefern Informationen zur Berechnung des LST. Jedoch sind die Daten entweder mit niedriger räumlicher oder zeitlicher Auflösung verfügbar, was die Überwachungen von Änderungen in kleinräumigen Gebieten nicht möglich macht. Um diese Lücke zwischen räumlicher und zeitlicher Auflösung zu schließen, wurden downscaling-Methoden entwickelt, die eine räumliche Auflösung von 30m erreichen. Das Ziel dieser Masterarbeit ist es, einen Algorithmus zu entwickeln, der eine Auflösung von 10m erreicht, um Überwachungsanwendungen mit hohen Auflösungen zu erreichen. Die Kombination aus Sentinel-1 (S1) und Sentinel-2 (S2) liefert einen vielversprechender Ansatz, da beide hohe Auflösungen mit sich bringen. Des Weiteren korreliert S1 mit LST aufgrund seiner Sensitivität mit dem Wassergehalt von Vegetation. Zusammen mit einem Digitalen Geländemodell (DEM) bilden Bänder und Indices abgeleitet von S1 und S2 die Prädiktoren um ein Random Forest Modell zu trainieren. Vier Strategien bestehend aus einem feature-Satz, einer Evaluierungsmethode und einer festgelegten räumlichen Auflösung wurden getestet. Die erste Strategie benutzt die gleiche Satellitenszene in verschiedenen Auflösungen. Das Random Forest Modell trainiert dazu features gegen S3 LST mit einer Auflösung von 1000m, während das Modell gegen 30m aufgelösten Landsat-8 (L8) LST getestet wird. In den anderen Strategien findet die räumliche Kreuzvalidierung Anwendung. Dabei werden die Daten in vier Teilmengen unterteilt. Das Training des Random Forest Modells erfolgt dann mit mit dem Trainingsdatensatz bestehend aus drei der vier Teilmengen, während die vierte als Testdatensatz dient. Zum einen wird die räumliche Kreuzvalidierung mit 1000m und zum anderen mit 30m aufgelösten Daten durchgeführt. Da die Daten mit einer Auflösung von 30m gegen L8 LST trainiert werden, kann hier zusätzlich S3 LST als feature eingebunden werden. Die besten Ergebnisse werden mit einem Trainingsdatensatz bestehend aus B12, DEM, NDVI, NDWI, SRWI und S3 LST erreicht. Durch den Vergleich prädizierter und wahren LST, ergibt sich für den mittleren quadratrischen Fehler (RMSE) ein Wert von 1.62K, während das Bestimmtheitsmaß (R2) 0.73 und der Korrelationskoeffizient 0.86 beträgt. Insgesamt tendiert das trainierte Random Forest Modell dazu, niedrigere Temperaturen für urbane Gebiete und höhere Temperaturen für Wälder zu schätzen. Von S1 abgeleitete features tragen nicht dazu bei die Ergebnisse zu verbessern. Ursache dafür könnte der von den anderen Daten abweichende Aufnahmezeitpunkt sein oder dass andere Untersuchungen eher Bodenfeuchte als feature verwenden, welche aus der S1 Rückstreuung abgeleitet wird. Insgesamt stellt sich die Verwendung der räumlichen Kreuzvalidierung als Evaluierungsmethode nicht als geeignet heraus und könnte zu einer geringeren Verlässlichkeit der Ergebnisse führen. Des Weiteren scheinen die features nicht genügend Informationen mitzubringen, um die Beziehung zwischen ihnen und LST vollständig erklären zu können. Um dies zu lösen, sollten verschiedene Kombinationen der features ausprobiert und neue hinzugefügt werden, wie zum Beispiel die Bodenfeuchte, fractional green vegetation cover und Lufttemperatur.
Auswertung von Umwelteinflüssen auf Phänologie mittels dichter Landsat- und Sentinel-2-Zeitreihen von Anden-Araukarienwäldern in Chile
Studiengang
MSc Geodäsie
Verteidigungsdatum
19.08.2021
Betreuer
Matthias Forkel, Jaime Hernández (Universidad de Chile)
Zusammenfassung
Araucaria araucana, allgemein bekannt als „Chilenische Araukarie“, ist eine endemische, immergrüne Nadelbaumart, die in den gemäßigten Wäldern der südamerikanischen Anden wächst und eine große kulturelle Rolle für indigene Bevölkerungsgruppen und für die chilenische Identität spielt. Sie tritt in der Regel zusammen mit verschiedenen Scheinbuchen-Arten (Nothofagus spp.) auf mit denen sie die charakteristischen Araukarien-Scheinbuchen-Wälder formt. Die Ausbeutung durch den Menschen und der Mangel an Konservierungsstrategien hat zu einer großflächigen Landschaftszerschneidung in Chile und Argentinien geführt, ihrem einzigen natürlichen Verbreitungsgebiet. Die Auswirkungen des anhaltenden Klimawandels sind eine weitere bedeutende Bedrohung für das Waldökosystem. Die Analyse phänologischer Eigenschaften ist einer der Schlüsselfaktoren für die Erfassung lang- und kurzzeitiger Pflanzenwachstumstrends. Jedoch wurde bislang noch keine Studie durchgeführt, die die Phänologie von Araukarienwaldbeständen untersucht. In dieser Masterarbeit wurden die natürlichen phänologischen Variationen von unberührten Araukarienwäldern in einem chilenischen Nationalpark zwischen 2016 und 2020 mittels hochauflösender Satellitendaten analysiert. Dichte NDVI- und EVI-Zeitreihen aus Landsat 8- und Sentinel-2-Beobachtungen wurden geglättet und interpoliert und phänologische Parameter wie das Einsetzen des Ergrünens und der Seneszenz wurden extrahiert, nachdem im Vorfeld mehrere dafür geeignete Verfahren geprüft worden waren. Diese Metriken wurden anschließend präzise ausgewertet und unter Nutzung eines Random Forest-Modells mit Unterschieden in Topografie, Klima, Artenkomposition und Baumhöhe verglichen, um die treibenden Faktoren der Phänologievariationen identifizieren zu können. Die Ergebnisse zeigten große Abhängigkeiten des Beginns und Endes der Vegetationsperiode von der Höhe, wobei Forstbestände über 1400 m eine zunehmende Verzögerung in der Reaktion aufwiesen. Der Maximalwert der Vegetationsvitalität pro Jahr war ebenfalls positiv korreliert mit dem Zeitpunkt phänologischer Ereignisse. Weiterhin wurde ermittelt, dass das Wachstum in Gebieten, in denen Nothofagus dombeyi die vorherrschende Spezies darstellt, im Mittel früher, und in Gegenden, in denen Nothofagus antarctica dominiert, später beginnt. Vermutlich damit verbunden sind die Resultate für die Baumhöhe, wobei hohe Bäume einen frühzeitigeren Start ihrer Vegetationsperiode erfahren und umgekehrt. Seneszenz-Aktivitäten wiesen deutlich weniger räumliche Unterschiede auf. Zeitlich konnte kein klarer Trend beobachtet werden, jedoch wurden kleinere Einflüsse des Klimas aufgezeigt. Es wurde darüber hinaus festgestellt, dass EVI ein viel besserer Indikator für die Pflanzenproduktivität in der Region ist als NDVI. Die Ergebnisse belegen, dass es verschiedene phänologische Unterschiede innerhalb des komplexen Araukarienwald-Ökosystems gibt. Diese Charakteristiken und deren Einflussfaktoren helfen dabei, die Dynamiken von unberührten Forstbeständen in der Region, gerade im Hinblick auf die zukünftigen Herausforderungen durch den Klimawandel besser zu verstehen und können lokalen Behörden als Basis dafür dienen, bessere Waldnutzungs- und Schutzstrategien innerhalb und außerhalb von geschützten Gebieten zu entwickeln. Als Teil eines gemeinschaftlichen Projekts zwischen der TU Dresden und der Universidad de Chile liefert diese Masterarbeit außerdem einen wichtigen Beitrag für anhaltende Forschungsaktivitäten zur Untersuchung von Auswirkungen menschlicher Einflüsse auf das Araukarienwald-Ökosystem.
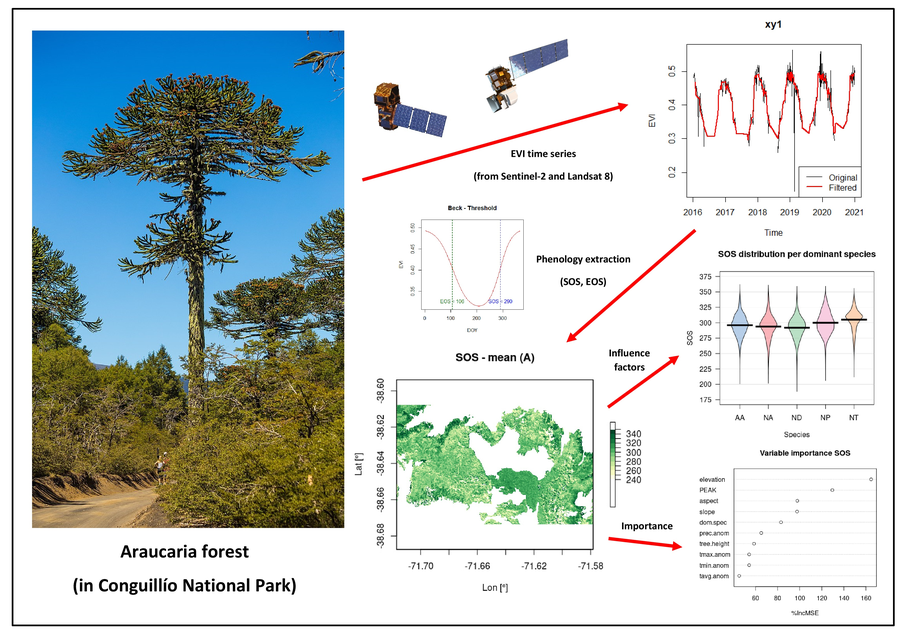
Graphische Zusammenfassung
Potential von CNNs für die Analyse der Landbedeckung mithilfe historischer CORONA-Daten
Studiengang
MSc Geographie
Verteidigungsdatum
15.10.2020
Betreuer
Matthias Forkel, Pierre Karrasch
Zusammenfassung
Die Landbedeckung und das Klimasystem sind eng vernetzte Komponenten. Dadurch hat auch die jahrzehntelange Veränderung der Landbedeckung einen erheblichen Anteil an dem Klimawandel. Mithilfe der Fernerkundung und der zivilen Landsat-Satelliten ist es möglich, seit 1972 die Landbedeckung kontinuierlich zu überwachen. Allerdings gab es schon früher Bestrebungen, die Erde mit Satelliten zu observieren. Das militärische Satellitenprogramm CORONA konnte von 1959 bis 1972 einkanalige Bilder der Erdoberflächen aufnehmen. Diese wurden erst 1995 der Öffentlichkeit zugänglich gemacht. Bis heute sind sie eine kaum genutzte Datenquelle für die Landbedeckungsänderung weltweit. Ziel dieser Arbeit ist es, ein Convolutional Neural Network (CNN) zu entwickeln, das die Landbedeckung automatisiert aus den CORONA Bildern gewinnen kann. Das CNN soll anhand der Untersuchungsgebiete Sächsische Schweiz und Zittauer Gebirge im Jahr 1965 trainiert und evaluiert werden. Ein CNN ist eine Methode des maschinellen Lernens, welche sich besonders für die Verarbeitung von Bilddaten eignet. In der Fernerkundung wurden CNNs bereits erfolgreich für die Objekterkennung und Klassifikation von multispektralen Daten eingesetzt. Bisher gibt es jedoch nur wenige ausführlichen Untersuchungen bei der Verwendung von einkanaligen Bildern für die Landbedeckungsklassifikation.
Für diese Masterarbeit wurden drei verschiedene Eingabedaten aus den CORONA-Daten erstellt: das Erste sind die unveränderten, originalen Pixelwerte der CORONA-Bilder; das Zweite sind berechnete GLCM Texturmaße, welche zur Berechnung die Nachbarpixel miteinbeziehen; das Letzte sind die originalen Pixelwerte zusammen mit den Landschaftsmetriken einer vorangegangenen Segmentierung. Auf Basis dieser Eingabedaten und vorhandenen Informationen über die Landbedeckung der Untersuchungsgebiet im Jahr 1965 konnten Bildausschnitte für die einzelnen Landbedeckungsklassen extrahiert werden. Diese Bildausschnitte dienen des Lernens beziehungsweise Trainierens des CNNs. Insgesamt wurden sechs verschiedene Trainingsoptionen untersucht, welche mit und ohne Regularisierung stattfanden. Die erste Erkenntnis aus dem Training war die sehr geringe Genauigkeit der CNNs, welche auf den Landschaftsmetriken trainierten. Mit einer Genauigkeit von unter 50% waren sie weit unter den Ergebnissen der anderen beiden Eingabedaten von 85% bis 90%. Daraufhin wurden die Eingabedaten der Landschaftsmetriken nicht mehr für die restliche Studie verwendet. Nach Abschluss des Trainings wurden die Genauigkeiten der CNN Modelle miteinander verglichen und die besten Drei mit Genauigkeiten von 83% auf die beiden Untersuchungsgebiete angewandt. Dabei klassifizierte ein Modell auf den originalen Pixelwerten und die anderen beiden auf den Texturmaßen.
Mithilfe eines iterierenden Suchfensters wurden die CNN-Modelle auf die Untersuchungsgebiete angewendet. Dabei konnten für das Untersuchungsgebiet Sächsische Schweiz Klassifikationsgenauigkeiten zwischen 69% und 75% erzielt werden. Die Anwendung auf das Untersuchungsgebiet Zittauer Gebirge erzielte keine so hohen Werte. Für die Eingabedaten der originalen Pixelwerte wurde eine Genauigkeit von 61% erreicht und für die Texturmaße lediglich eine Genauigkeit von 1,8% und 3,5%. Diese Ergebnisse deuten auf ein Übertrainieren des Modells hin, da es in dem Zittauer Gebirge weit schlechtere Genauigkeiten erreicht wurden. Ursachen dafür könnten eine ungleiche Verteilung der Trainingsdaten für die einzelnen Landbedeckungsklassen, diverse Unterschiede zwischen den beiden CORONA-Bildern, und eine Homogenität der Bildwerte zwischen den einzelnen Landbedeckungsklassen sein. Eine abschließende Analyse des Landbedeckungswandels zwischen 1965 und 2012 konnte eine Erhöhung der Siedlungs- und Landwirtschaftsflächen feststellen. Das Gebiet Zittauer Gebirge ist besonders durch den Tagebau und die anschließende Umnutzung als Tagebausee geprägt. Die bewaldete Fläche hat sich in den 47 Jahren nicht maßgeblich verändert.
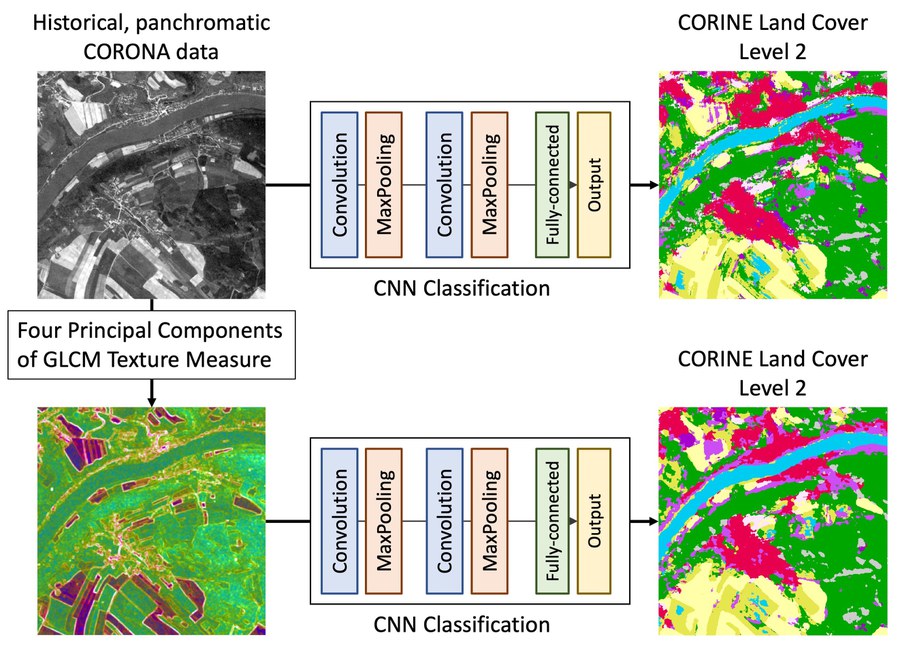
Graphische Zusammenfassung
Potential von multi-temporalen Sentinel-2-Daten zur Ableitung des Feuchtegehalts von Blättern (Live Fuel Moisture Content)
Studiengang
BSc Geodäsie
Verteidigungsdatum
08.10.2020
Betreuer
Matthias Forkel, Luisa Schmidt
Zusammenfassung
Die Ziele dieser Arbeit sind die Beurteilung bereits erprobter spektraler Indi-
zes, die Entwicklung neuer Ansätze im Bereich der Vegetations-Red-Edge und
die Entwicklung von multi-variaten Regressionsmodellen auf Grundlage reflek-
tierter Strahlung zur Abschätzung des Live Fuel Moisture Content (LFMC).
Als Datengrundlage dienen optische Sentinel-2-Daten und LFMC-In-situ-Daten
der National Fuel Moisture Database. Ergebnisse aus anderen Studien können
hinsichtlich der Beurteilungskraft von Indizes im kurzwelligen Infrarot nicht be-
stätigt werden. Dagegen legen die Ergebnisse dieser Arbeit für die Indizes im
und um den Bereich der Red Edge eine sehr gute Eignung nahe. Zum Zweck der
Modellentwicklung wird zusätzlich eine neue Methode entwickelt, mit der stark
miteinander korrelierende Indizes mittels explorativer Faktorenanalyse (EFA) in
latente Faktoren überführt werden, um das Problem multi-variater Modelle mit
Multikollinearität zu lösen. Zusätzlich wird ein Workflow für die Entwicklung
mit dieser Methode vorgebracht. Weiterhin werden diese latenten Faktoren in
multi-variaten Regressionsmodellen mit anderen Indizes kombiniert. Diese wer-
den für die Landbedeckungsarten Busch- und Grasland erarbeitet und liefern
beide ähnliche Ergebnisse mit R2 = 0.610 für Busch- und R2 = 0.666 für Gras-
land. Zusätzlich werden die Spezifikationen der entwickelten Modelle individuell
an einzelnen Vegetationsspezies und Standorten getestet. In diesen Tests zeigt
sich die Robustheit der entwickelten latenten Faktoren und der entwickelten
LFMC-Modelle im Vergleich zu den individuellen Indizes.
Developing Data Cylinders to map changes and feedbacks between Arctic Sea Ice and Vegetation
Study
MSc Cartography
Date of defence
2020-09-28
Supervisor
Matthias Forkel, Dr. Paulo Raposo (University of Twente)
Abstract
Arctic sea ice hits second-lowest level on record in 2020 and a “new Arctic” climate era is
commencing (Landrum & Holland, 2020). Living on a planet which is facing a global climate change, the understanding and the communication of those vast environmental changes have great importance. The objective of this thesis is the development of a three-dimensional spatio-temporal visual, in a cylindrical shape due to the circularity of the Arctic region, depicting the analysis of the changes of the sea ice and vegetation in the Arctic. Level4 remote sensing data is used for the vegetation and sea ice concentration in a pan-arctic scale for the needs of this research. Its main outcomes are the changes themselves mirrored through their anomalies, and the creation of one cartographic product which illustrates these phenomena in the best suitable way.
The representation of time and space in a single visual has been viewed as a challenge in the field of modern cartography throughout many decades. While data-cubes have been proposed for regional or even global geographical data visualization, the polar regions seem not suitable for such cubes. The proposed cartographic representation of the Arctic space and time into “Data-Cylinders” responds to the challenging befitting of physical phenomena along space and time.
The context of the “Data-Cylinders” includes the visualization of the changes of climatic and physical phenomena in the form of time-series. A cylinder in this case could be described as many circular maps on top of the other in chronological order. “Space” in this scenario is placed across cycles, while “time” is given along the height of the cylinder.