Topics for BSc/MSc theses
We are happy that you are interested in a Bachelor or Master thesis in the Environmental Remote Sensing group.
Topics and application for supervision
Usually many students are interested in writing a thesis with the Envrionmental Remote Sensing group. However, in order to guarantee a good supervision of your BSc or MSc thesis, we are able to only supervise a limited number of students. Therefore we ask you to apply for supervision if you are interested in writing a BSc or MSc thesis with us. In case of a too high number of students, we will use your application to select to whom we can offer a supervision.
Here you can find potential topics and you can apply for supervision: https://bildungsportal.sachsen.de/opal/auth/RepositoryEntry/47204204546/CourseNode/1732246660199091010
Alumni and finished theses
In the following you find a short summary and graphical abstract of finished BSc and MSc theses.
Developing an identification key for fuel models by Scott & Burgan for application in Saxony
Study
Bachelor Forest Sciences
Date of defence
28.03.2025
Supervisor
Matthias Forkel, Clemens Holzweißig
Abstract
The aim of this work was to create a key for determination of fuel models for use in the field and relevant for Saxony. A classification of the fuel models was determined by the general fire-carrying characteristics and then related to the fuel models of Scott and Burgan (2005). The key also considered the forest climate as well fuel characteristics. Currently the key is in written form but is planned to be made available for digital use. Using the key, the user can determine the closest match to the Scott and Burgan models. However, the subjectivity i.e. user bias should be noted and whilst some examples of use are presented, the key requires further testing and validation in the field.
Identifying the future of remote sensing for monitoring of post-mining landscapes in Saxony
Study
MSc Geoinformation Technologies
Date of defence
22.01.2025
Supervisor
Matthias Forkel, Dr. Jan Kaplon (Wroclaw University of Environmental and Life Sciences)
Abstract
The exploitation of the Lusatian landscape for lignite mining has resulted in the disruption of the natural environment. Extensive rehabilitation measures are being implemented with the objective of restoring the region's ecological functions, stabilising conditions and promoting socio-economic uses. It is essential to monitor these measures to ensure rehabilitation objectives are met and to prevent any potential dangers to humans and the environment, given the scope of the area and complexity of the tasks, this requires substantial human and financial resources. This thesis examines how remote sensing technologies can support and enhance the current approach for monitoring post mining landscapes in the Lusatian mining district and its future role in the existing legislative framework. To investigate this question a mixed method approach is employed. This encompasses the collection of qualitative data through interviews and a survey, with the objective of gaining insights into the monitoring framework and monitoring methods employed. Furthermore, a semi-systematic literature review is conducted to explore the developments and potential applications of remote sensing. The case studies employed utilise freely accessible earth observation data from platforms such as Sentinel-2 and MODIS to calculate vegetation indices, model soil moisture and carry out automated biotope mapping using a random forest machine learning algorithm. The findings reveal that the responsibilities are clearly distributed among the involved institutions, while regulatory frameworks define monitoring standards and promote the utilisation of new, reliable techniques. Remote sensing data is predominantly used in geotechnical monitoring, only utilised to a limited extent in FFH (Fauna-Flora-Habitat) monitoring and biotope mapping in the form of aerial photographs and not used in hydrogeological monitoring. The potential for enhancement is evident across monitoring domains, particularly in FFH-monitoring with the use of environmental indices and metrics determining biodiversity. The utility of the environmental indices NDVI and RSEI, as well as the calculated SSM (Soil Surface Moisture) model, is validated by case studies utilising Sentinel-1, Sentinel-2 and MODIS data. Despite the promising results, the SSM has limited applicability to post-mining lakes undergoing filling. Estimates of complex biodiversity traits, hyperspectral data, and automated biotope mapping using supervised machine learning do not meet the requirements of the regulations and will not be employed in the near future. LiDAR and, potentially, temporal and spatial enhanced SAR (Synthetic Aperture Radar) methods will continue to play an important role in future geotechnical event monitoring.
An assessment of the relationship between air quality and city characteristics using satellite data for cities in the Southern hemisphere
Study
MSc Geoinformation Technologies
Date of defence
13.11.2024
Supervisor
Matthias Forkel, Peter Schauer (IABG)
Abstract
According to the World Health Organisation, 99 % of the world's population live in places where air pollution exceeds the recommended values. Urban populations are particularly affected due to high population densities, mobility patterns, and the resulting elevated levels of emissions from industrial activities and traffic. Air pollutants, including PM2.5, SO2, NO2, and CO, have severe impacts on human health, making accurate and reliable monitoring essential. While ground-based measurements are reliable, they are often cost-intensive and limited in spatial coverage. However, satellite-based measurements, particularly from TROPOMI, offer broader coverage and high-resolution data on a daily basis. This thesis examines cities in the Southern Hemisphere, a region heavily impacted by air pollution due to overpopulation and rapid urbanisation but largely understudied, especially in sub-Saharan Africa. Using linear regression models, the relationship between air quality and city characteristics, such as population size, GDP per capita, shares of built-up, green spaces and industrial areas, coastal proximity, and elevation, is analysed across 84 cities in Africa, Oceania and South America. The findings indicate no consistent regional or supra-regional trends linking city characteristics with air quality indicators. Instead, specific factors show varying degrees of influence by region. Factors that show a stronger correlation include the population size, GDP per capita, the location and the share of industrial area. In Oceania, the population play a crucial role in air quality, while in South America, coastal cities display often higher pollution levels. Interestingly, the share of green spaces or the built-up area does not significantly impact air quality as expected. These outcomes underline the complexity of air quality assessment and suggest that future research should focus on more city-specific analyses. This research provides a foundational understanding of the relationship between certain city characteristics and the air quality in the Southern Hemisphere, as it is one of the first studies to do so. Future research may benefit from investigating additional factors, such as transportation and meteorological conditions, and exploring advanced models like deep learning techniques.
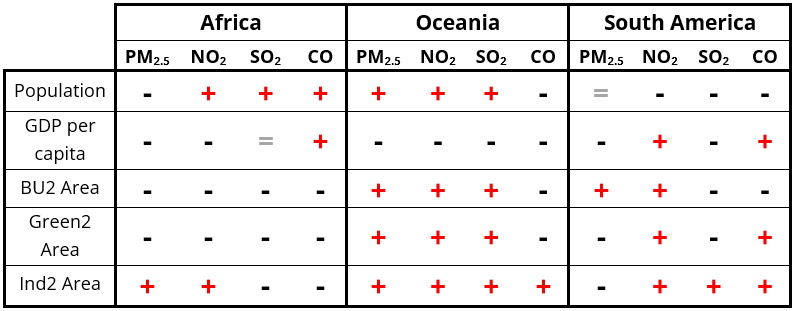
Graphical Abstract: Overview of the bivariate regression trends between the examined city characteristics and the air quality indicators for the different regions. The '+' represents a positive trend, meaning an increase of the air quality indicator concentration with a simultaneously increase in the respective city charcacteristic. The ‘-‘ represents a negative trend and ‘=’ a neutral trend
Classification of vegetation in post-mining areas in the Lusatian Lakeland with RapidEye and PlanetScope data
Study
Bachelor Geodesy and Geoinformation
Date of defence
24.10.2024
Supervisor
Matthias Forkel, Christopher Marrs
Abstract
Lignite mining in opencast mines has resulted in a profound change to the cultural landscape, as can be seen in Lusatia. The Lusatian Lakeland is being created as a result of the flooding of the mines in the Lusatian lignite mining area. Many of the former mines have already been flooded or are still being flooded. Currently, coal is still being actively mined in three opencast mines, namely Nochten, Reichwalde and Welzow-Süd. The latter is the subject of this study.
Lignite mining in the Welzow-Süd opencast mine began in 1966 and is expected to end between 2027 and 2030. Unlike many opencast mines in the Lusatian mining district, Welzow-Süd will not be flooded, but completely recultivated and renaturalised. This makes the opencast mine particularly interesting for the observation of land cover change with a focus on vegetation in the recultivation process using satellite data.
As part of this work, land cover maps are created and specific land use changes of the classes are calculated in hectares. Spatially high-resolution RapidEye and PlanetScope data with a resolution of 5m are used as a database. The land cover analysis is based on four points in time in the early summer of 2009, 2015, 2019 and 2024 and comprises eight land cover classes.
Land use classification is performed using unsupervised k-means clustering. Input parameters are the spectral bands of RapidEye and PlanetScope as well as the Normalized Difference Vegetation Index (NDVI) and the Normalized Difference Water Index (NDWI). Before applying the clustering algorithm, the open-cast mining area is divided into several subsets in order to separate areas with the same characteristics but different classifications (e.g. spoil heaps and open sandy areas).
The accuracy analysis delivers a solid overall accuracy of 78 %. Forest, open-cast mining and spoil heaps are reliably identified. There are difficulties in differentiating between bare ground areas and fallow fields and also in differentiating between “green” field areas, newly afforested areas and sparsely vegetated areas. Transitions between afforested and wooded areas are difficult to define and differentiate due to the purely visual data. In addition, water areas are insufficiently recognised and must be added manually.
Nevertheless, the potential of high-resolution satellite data for the observation of opencast mining areas and their subsequent landscapes is evident. However, there is a need to improve the methodology in order to fully use the potential of remote sensing data. It is conceivable to use a different classification algorithm such as the supervised random forest, which could use the clusters of the k-means algorithm as reference data. Alternatively, the data basis for k-means clustering could be extended by LiDAR data, especially elevation data, or a panchromatic band for deriving texture measures.
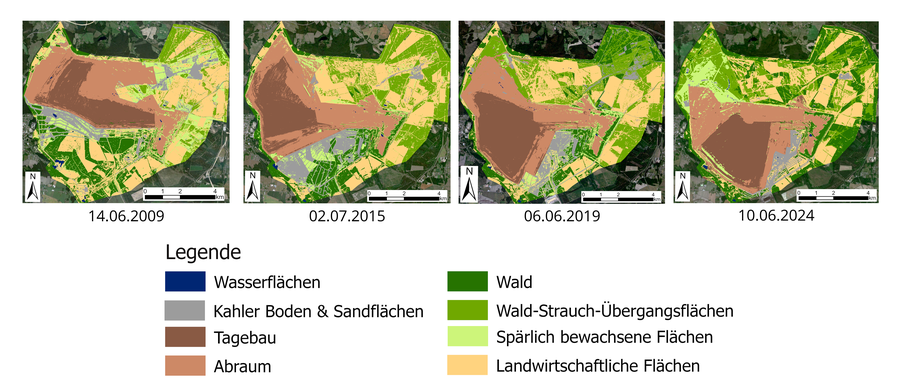
Graphical abstract
Indentifying hotspots of changes in vegetation biomass - focusing on the Amazon region
Study
MSc Geodesy
Date of defence
05.09.2024
Supervisor
Christine Wessollek, Naixin Fan
Abstract
Accurate quantification of vegetation carbon stock (Cveg) and ∆Cveg is crucial for understanding the carbon cycle and mitigating climate change. Remote sensing methods have emerged as a prominent tool for Cveg estimation, but the optimal combination of satellite products and processing methodologies remains uncertain. This is evident in the emergence of multiple dynamic remote sensing data products, related to ∆Cveg, with various input data, frameworks and applications. This study compares a selected number of these datasets used to monitor Cveg and ∆Cveg across the South American tropics, focusing on the Amazon region, and evaluate their agreement. The study establishes a baseline framework for comparing diverse vegetation change products, revealing that meaningful evaluations can be conducted primarily for loss hotspots with the greatest agreement in larger loss areas and main disagreements in smaller loss events. It finds the best agreement on loss in larger hotspots primarily based on area rather than Fractional Vegetation Change (FVC) values, with main disagreements in smaller loss events, and therefore highly dependent on the characteristics of the considered datasets. The primary contribution is not a comprehensive comparison of dataset agreement on vegetation change hotspots but a base framework to allow for meaningful agreement evaluations. Overall, the study shows that comparison between widely varying datasets is possible, but results depend heavily on the datasets employed. Therefore, datasets should first be assessed on their usefulness and limitations for result comparisons. The study provides useful suggestions for future comparisons of dynamic Cveg datasets with similar characteristics and establishes a benchmark for loss evaluation expectations in agreement analysis.
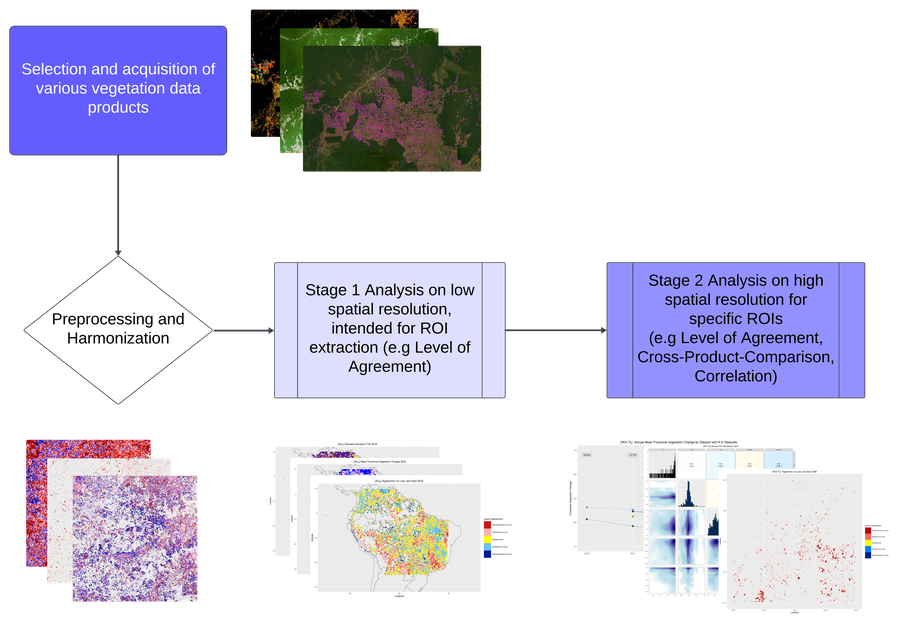
Graphical abstract
Development of a method to classify the trafficability of forest roads for emergency vehicles using open geodata
Study
MSc Geodesy
Date of defence
16.05.2024
Supervisor
Matthias Forkel, Patrick Brausewetter (Fraunhofer Institute for Transportation and Infrastructure Systems)
Abstract
Climate change is resulting in increasing periods of heat and drought and leading to an increase in the general risk of forest fires. During several forest fires in the Saxon Switzerland National Park in the summer of 2022, various challenges arose for the various emergency services in attendance. Access to enable the suppression of the fires proved difficult and time-consuming due to the challenging terrain of the National Park as well as isolated, widely separated fire sites. This, in conjunction with the inadequate base maps of the area, made operational planning difficult. Other studies in the past have already dealt with the identification of paths and roads in forested regions, but until now there has been no special focus on the requirements of emergency services, who need the data for coordination and navigation during operations and need to interpret it quickly. Thus, the aim of this thesis is to develop a method of using open geodata and open-source software to identify and extract both paved and unpaved forest roads and classify them based on their navigability according to the requirements of emergency services. To achieve this, expert interviews are conducted with THW (a German federal civil protection organisation) and the fire services, which were involved in the 2022 operations, to develop a corresponding target-oriented classification of access routes. A method is presented in which multilayer rasters are created by pre-processing airborne laser scanning data (LiDAR) and digital orthophotos of the GeoSN (State Office for Basic Geoinformation Saxony), as well as OpenStreetMap (OSM) vector lines representing forest roads. These rasters cover an investigation area of 4 tiles of 2km x 2km each. A pixel-based supervised classification algorithm, a Random Forest, is used to divide the study area into road and non-road classes. These class predictions are then compared with the OSM paths, resulting in a general accuracy of over 95%. For a detailed analysis, the accuracy characteristics completeness, correctness, and quality of the road class are also investigated, resulting in low values of 14-35%, 12-24% and 7-14%. This paper identifies the main source of error and illustrates the importance of accurate ground truth data at the same time. Accordingly, the use of OSM paths is discouraged in the future. Finally, it is shown that the developed method offers a good reproducible approach. The adaptation and expansion options discussed in this thesis can provide a good starting point for successfully processing data for emergency services in forest fire scenarios in the future and thus contributing to an increase in efficiency during such operations.
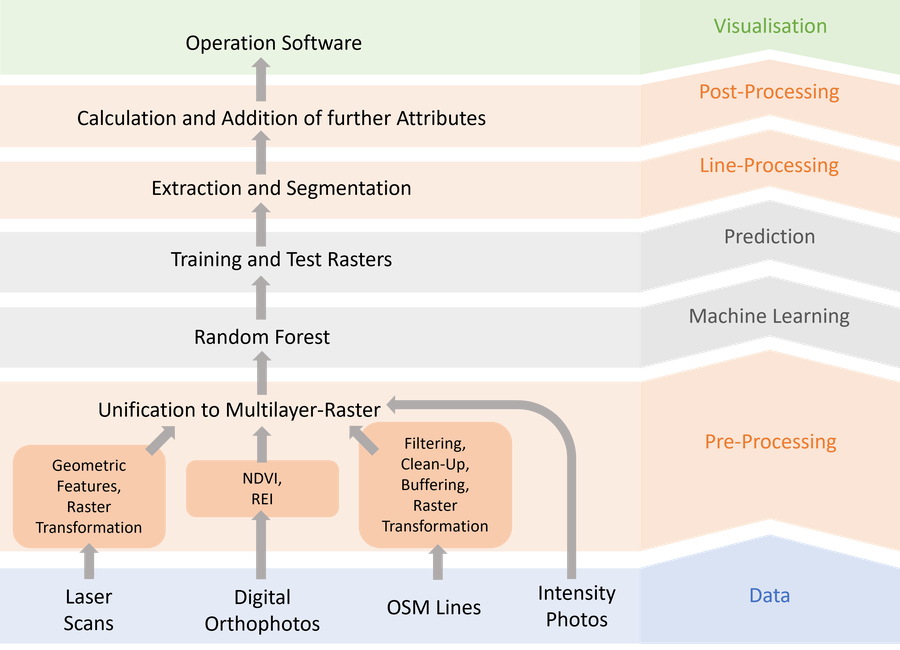
Graphical abstract
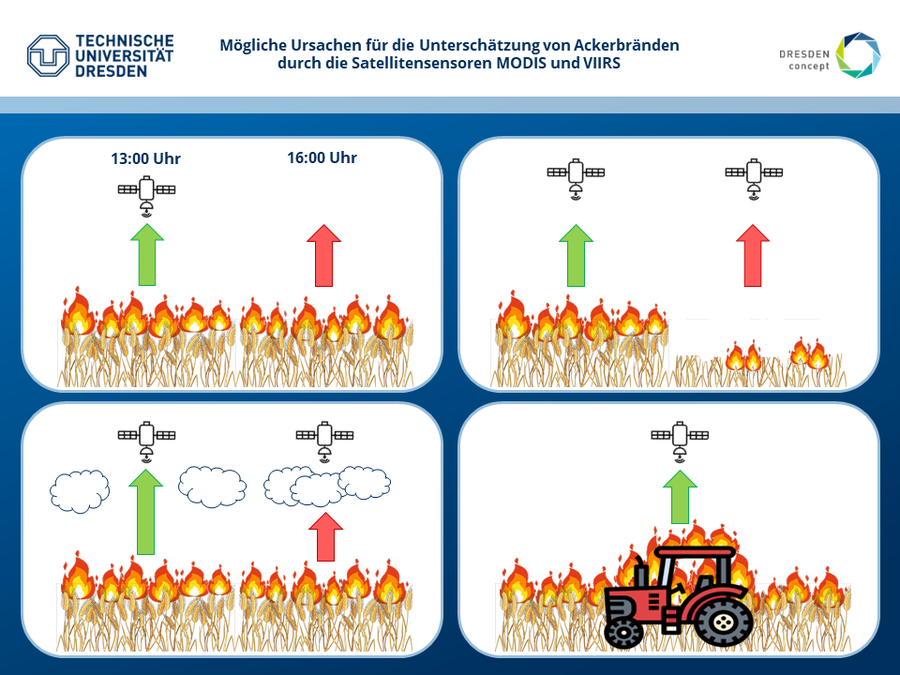
Evaluation of the ability and limitations of VIIRS and MODIS sensors for the detection of fires on agricultural land in Saxony, Sachsen-Anhalt and Thüringen
Study
Bachelor Geography
Date of defence
06.02.2024
Supervisor
Christine Wessollek, Christopher Marrs
Abstract
Fires on agricultural fields have serious consequences for human health and climate change. On the one hand, they worsen air quality locally, while on the other hand their emissions are released into the atmosphere globally, which increases the greenhouse effect and promotes climate change. In addition, the black carbon produced by fires can be carried to the poles and reduce the albedo effect there. Many agricultural fields are set on fire after they have been harvested in order to quickly and cheaply remove remaining crop residues and prepare the field for the next sowing. Due to the numerous negative consequences of burning fields, this common agricultural practice has been banned by the European Union. Despite the bans, some farmers defy the regulations and continue to set fire to their fields. Especially in countries that do not belong to the European Union, fields are still being burned after harvesting. In Germany, the intentional burning of agricultural fields has been well contained. However, many cropfires also occur unintentionally during harvesting. In the high summer temperatures, dust deposited in the engine compartment ignites very easily, or sparks are caused by stones rubbing against the cutting mechanism of the machines. Reliable documentation of such fires is necessary in order to record the resulting emissions and assess the consequences for climate change and local air quality. Illegally ignited fields can also be identified in this way. The MODIS and VIIRS satellite sensors are well suited for this purpose because they fly over the mid-latitudes up to four times every noon. However, both sensors continue to underestimate many fires. Until now, this has been attributed to unfavourable overpass times, too small an extent of the fires and too much cloud cover. In this study, 46 cropfires in central Germany from 2023 were researched from newspaper articles and fire brigade reports on the Internet and their detection by the MODIS and VIIRS satellites was examined. In addition, fire characteristics such as field cover, cloud cover or fire area were examined to identify possible reasons for the underestimation of the fires. The investigation revealed that the MODIS sensor performed very poorly in detecting the fires. Only one fire was detected by it, which is mainly due to the sensor's lower spatial resolution of one kilometer. The VIIRS sensor, which has a spatial resolution of 375 meters, detected around a third of all fires. MODIS also does not have as large a scan width as VIIRS, which means that there were fewer MODIS overpasses in total. Two thirds of all fires remained undetected by both sensors, which is mainly because of too few overpasses. The fires mainly occurred at noon and early afternoon. Because the overpasses mainly took place at noon, many of the fires that occurred in the afternoon were no longer overflown and could not have been detected. Field cover also appears to influence the probability detecting the cropfires. Fields that were not harvested before the fire happened were detected more frequently than harvested fields. Cropfires under clear skies were also detected more frequently than fires that were covered by clouds. A connection between additional fire events such as allotment gardens or harvesting machines is suspected, as this increases the intensity of the fire and the amount of infrared radiation emitted. However, this correlation could not be confirmed with certainty. Cropfires in which part of a forest also burned do not appear to favor the probability of detection as long as only the forest ground is burning, because the tree canopy covers the emitted infrared radiation. Factors such as the burn duration or total area of the burned field had no direct influence on the probability of detection. When detecting agricultural fires, it is not the total burnt area that is important, but rather the intensity of the current fire front at the time of the satellite overpasses.
Graphical abstract
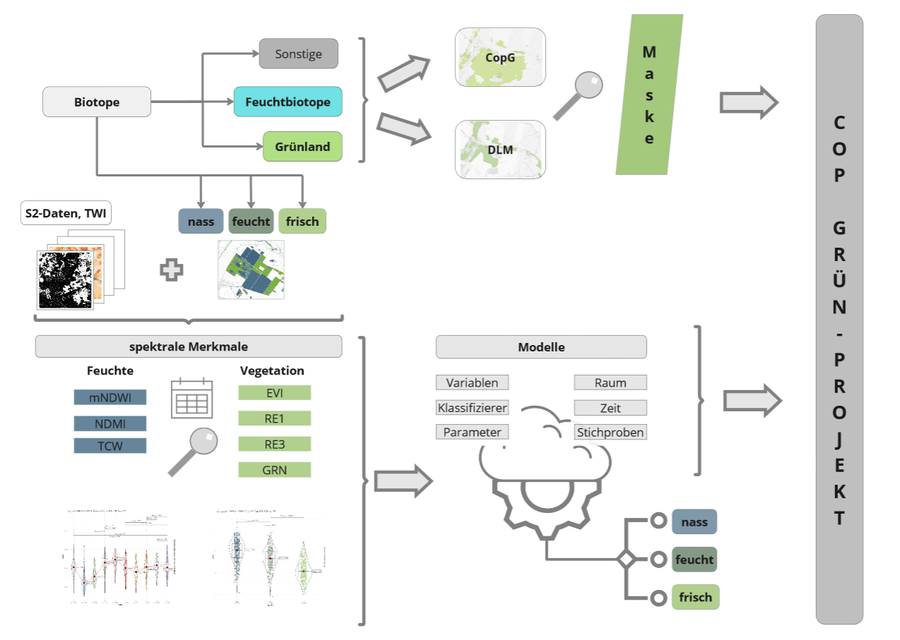
Potentials of classifying wet grassland using Sentinel-2 time series
Study
MSc Geoinformation Technologies
Date of defence
29.01.2024
Supervisor
Christine Wessollek, Anna Cord
Abstract
Wet grassland is of great importance for biodiversity and fulfils a variety of ecosystem functions. The nature conservation obligations to protect wet grassland on the basis of national and international laws and regulations require regular monitoring of its condition. This is recorded as part of terrestrial mapping, often only at long intervals. However, more frequent updating would be necessary as a basis for decisions on measures and for monitoring the achievement of objectives. Sentinel-2 remote sensing data is available in high temporal resolution, but its use for grassland monitoring has not yet been established nationwide. The investigations in this thesis focus on three main areas: a search space analysis for the derivation of the grassland mask, the evaluation of FE data and various model calculations. Using terrestrial survey data from the biotope mapping of two study areas (UG) in Saxony and Schleswig-Holstein, two different data sources (digital landscape model and Copernicus grassland) were analysed for their suitability as a grassland mask and compared in terms of their representativeness for the target types. For the moisture aspect, the topographic moisture index (TWI) and the time series of three spectral indices (MNDWI, NDMI and TCW) of the year 2022 were analysed. For the vegetation aspects, four characteristics (green band, red edge bands 1+3 and EVI) were statistically analysed with regard to three grassland groups of different moisture levels (wet / moist / average). There was only partial agreement between the two UG with regard to the most strongly differentiating features. For the Vogtland UG, the NDMI and TCW were significant in summer and the mNDWI in winter. In the Sorgeniederung UG, the mNDWI was most important in winter and summer, the NDMI in winter and spring and the TCW in summer. With regard to vegetation, the summer and autumn records of the indices in the Vogtland UG had a more differentiating effect, while in the Sorgeniederung UG the spring and autumn data of the indices were more useful for distinguishing the three groups. The identified features were then used as input data for classification models. Varying models in terms of feature selection, the scope of the input data, the model parameters, the target classes and temporal and spatial parameters were calculated using machine learning (ML) methods. Random Forest (RF) and Support Vector Machine (SVM) were used comparatively as classifiers. The differentiating features of the statistical analysis and the feature importance of the calculated models only partially matched. In many models, the moisture indices and the TWI were among the ten most important features. In the most accurate model in the Vogtland UG (M36) and the Sorgeniederung UG (M20), three of the five most important features were moisture-related. Models with a higher, uniform number of samples per grassland group achieve higher accuracies for wet grassland than models with stratified training and test data sets. Removing correlated features also improved model accuracy. The "moist" group showed the most misclassifications in almost all model variants. The F1 value for this group was below the values for the "wet" and "average" groups in almost all models. The accuracy of the different classification models varied greatly (kappa value between k=0.13 and k=0.7) and the F1 values for the wet grassland group also showed a wide range of variation (0.11 to 0.73). RF achieved a higher accuracy than SVM, but the influence of the classifier was clearly below the influence of the feature selection and the model parameters with the same input data.
Graphical abstract
Potential of remote sensing for mapping coral reef cover and historical changes in shallow coastal waters of Bonaire
Study
MSc Geoinformation Technologies
Date of defence
25.01.2024
Supervisor
Matthias Forkel, Sander Mücher (Wageningen University and Research)
Abstract
The degradation of coral reefs is a well-documented and unfortunately worldwide ongoing process. This process is caused by increasing human and non-human stressors that have a large impact on the coral reef. Stressors effect on different scales, such as locally (i.e., tourism), regional (i.e., rivers of South America) and globally, such as climate change. One of the main difficulties in the monitoring of coral reefs is the lack of historical data with a large spatial extant. The use of historical aerial photographs in combination with more recent very high-resolution satellite imagery can provide a powerful tool to identify changes. The benefits of those RS techniques have been discussed in different areas in the world. This thesis applies RS techniques on historical time series of imagery on the shallow coastal waters of Bonaire’s leeward side, to evaluate its potential in supporting future monitoring processes. It is shown that analyzing time-series of spaceborne and airborne imagery can produce reliable spatial information about coral cover and sand patches in the shallow coastal waters in combination with in-situ measurements. With an overall accuracy of 70% the image classifications provide reasonable to good information, that especially applies to corals and sand. Additionally, this thesis uses historical airborne imageries to detect changes of the coral reef over the past 60 years and compare them with different sources of information. The time-series analysis of historical imagery proofs strong changes in the coral cover, with a loss of 40% between 1961 and 2020/2021 and visualize them in a spatial context. The degradation of the reef and the expansion of sand patches varies a lot between different areas and over time. It is shown that the decline of coral cover hasn’t been stopped but slowed down during the last decades and for one part of the research area, an increase in the coral cover was observed. This research shows the benefits and prospects of remote sensing for mapping aquatic habitats and points out, what is necessary to improve the workflow in the future.
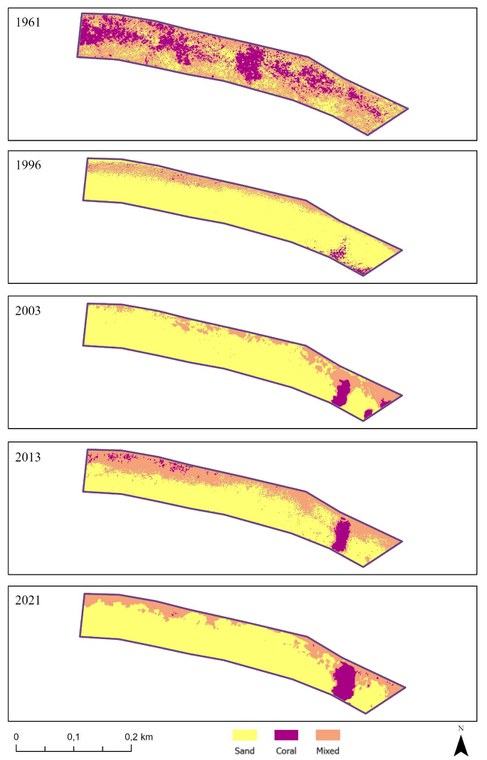
Excerpt of the mapping results
Wildfire Plume Detection and Investigation with Sentinel-5p
Study
MSc Geodesy
Date of defence
13.12.2023
Supervisor
Matthias Forkel, Jos de Laat (KNMI)
Abstract
Understanding the dynamics and characteristics of emission plumes from wildfires is of paramount importance for environmental monitoring and policy decisions. These plumes, composed of various greenhouse gases and pollutants, can have farreaching consequences on global climate, air quality and health. In this study, a data-driven approach to detect and characterise emission plumes from wildfires utilising TROPOMI (Tropospheric Monitoring Instrument) of the Sentinel-5p satellite observations of nitrogen oxides [NOx], carbon monoxide [CO] and aerosols. The analysis leverages VIIRS active fire data to identify locations of fire occurrence, laying the foundation for plume detection. The primary hypothesis states that a plume image consists of three components: a plume body or core, a transitional zone from plume to clear sky, and the clear sky itself. To realise this hypothesis, a data-driven unsupervised algorithm to identify and map plumes is developed, which is based in kernel functions to pre-process the Sentinel-5p images. These kernels effectively highlight plume-related features, allowing for more precise delineation. Subsequently, Gaussian Mixture Models (GMM) are utilised to classify the images into three components of the plume according to the main hypothesis. In instances where multiple plume candidates exist, a Gaussian distance weighting function to identify the likeliest plume is employed. Furthermore, the mapping of the plume-clean air transition zones is further evaluated by employing Monte Carlo simulations to validate and refine the transition zone assessments. To verify the detections, plumes of CH4, CO, HCHO, NO2 and aerosols for several plumes over the Amazon and Alberta are extracted and the plume properties are related to different landcover types. The findings of this study provide valuable insights into the development of an advanced methodology for plume detection, which has broad implications for the understanding and monitoring of fire emissions and atmospheric research.
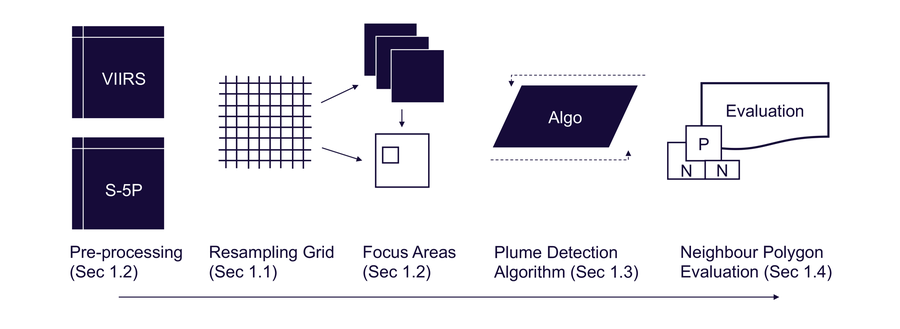
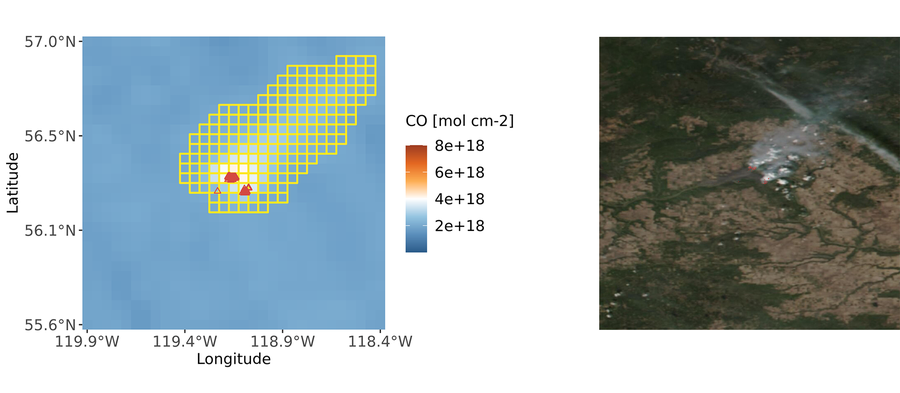
Workflow of the processing steps and exemplary result of a NO2 smoke plume detection in Alberta
Combining novel visualizations of temporal changes with maps using satellite time series of vegetation moisture
Study
MSc Cartography
Date of defence
23.11.2023
Supervisor
Matthias Forkel, Barend Köbben (U Twente)
Abstract
This thesis offers a practical and theoretical review on visualizing time series data for Life Fuel Moisture Content, Fire Weather Index, and Temperature, which all play significant roles in forecasting wildfire occurrences and spread. The study explores various techniques, including combining novel visualizations of Warming Stripes and the Climate Spiral with maps, to present the multivariate data of these fire risk factors. One visualization employs the Warming Stripes color scheme and small multiples to display the evolution and comparison of all three variables over time. Another visualization unites the Climate Spiral with choropleth maps to emphasize the seasonality and data accessibility of Life Fuel Moisture Content and Fire Weather Index. Furthermore, this thesis will provide an evaluation framework that demonstrates the superiority of the created visualizations compared to other selected spatio-temporal visualizations. Additionally, this research addresses a gap in the literature by evaluating the awareness and effectiveness of Warming Stripes. However, the survey results did not support the reputation of this visualization.
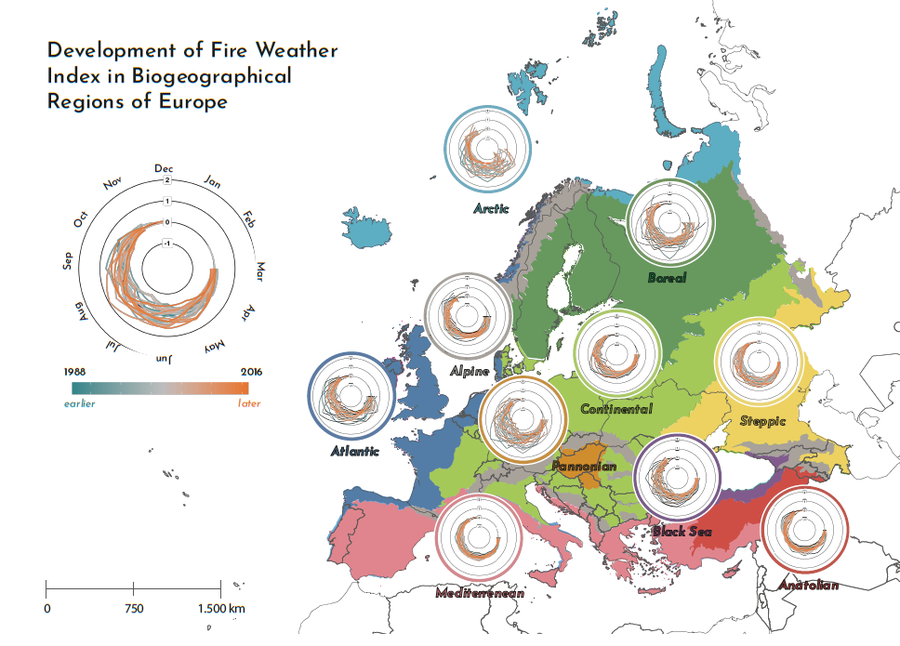
Modification of the Climate Spiral with Fire Weather Index
Mapping and Analysing Human Exposure to Wildfires in a Central European Context
Study
MSc Cartography
Date of defence
23.11.2023
Supervisor
Matthias Forkel, Mahdi Khodadadzadeh (U Twente)
Abstract
Climate change has been causing a noticeable rise in disastrous wildfires across Southern Europe. However, even Central Europe is not immune to such destructive events as a recent wildfire burned significant parts of the Saxonian Switzerland National Park in Germany and the Bohemian Switzerland National Park in Czech Republic. This acted as a warning for the scientific community and local stakeholders, that demonstrated the need to adapt to this new reality. In this context, this thesis attempts to create a wildfire preparedness map, for an area that includes the two affected National Parks as well as two adjacent Conservation Areas. This map aims to visualize the degree of exposure of human settlements to wildfires in this area. This map takes the form of a web-based interactive map. To that end, nine wildfire scenarios were devised, based on varying wildfire durations and weather conditions. The map was tested with the general audience for its usability and with stakeholders for its usefulness. Validation tests were also conducted using historical wildfire data for the study area.
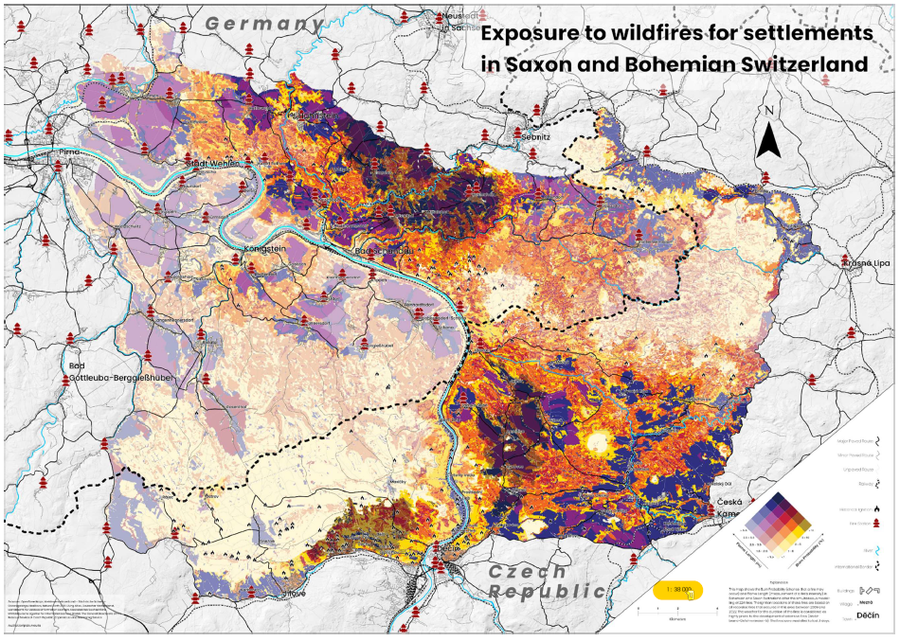
Static exposure map for wildfire scenario WBI = 5, duration = 3 days. Actual map size is A0.
Identification of approaches for deriving an indicator for determining vegetative drought stress in grassland sites based on remote sensing data in Saxony
Study
MSc Geodesy
Date of defence
10.08.2023
Supervisor
Christine Wessollek, Sebastian Goihl (LfULG)
Abstract
Drought stress is becoming increasingly important in times of climate change. The primary objective of this study is to develop a method for deriving an indicator that can be used to identify drought in grassland areas of Saxony. This indicator should have the potential to be integrated into the Saxon climate impact monitoring of the Landesamt für Umwelt, Landwirtschaft und Geologie (LfULG), with whose cooperation this work was developed. Four study areas in Saxony were chosen for the development of the method. These are located in the agricultural comparison areas (german: Vergleichsgebiete) 111 Düben-Dahlener Heide, 221 Sächsiche Elbtalniederung, 232 Elbsandsteingebirge und Zittauer Gebirge and 351 Erzgebirgskamm. The agricultural comparative areas of Saxony are summaries of areas in the Free State of Saxony with similar location factors such as soil properties, climate and altitude or relief. The data basis is formed by freely available Sentinel-2 data and monthly DWD precipitation data that have been atmospherically adjusted with Sen2Cor. The following indices were calculated with the available Sentinel-2 data: Normalized difference vegetation index (NDVI), Normalized difference water index (NDWI), Normalized difference drought index (NDDI), Normalized multi-band drought index (NMDI), Vegetation Condition Index (VCI) of the NDVI and NDWI. The Standardized Precipitation Index (SPI) was calculated from the monthly precipitation data. This data forms the basis for testing two machine learning approaches, specifically Random Forest and Support Vector Regression. Using these data and approaches, this work tested whether annual yield for grassland can serve as an indicator of drought or drought stress and whether yield estimation is possible using the aforementioned drought indices. The study period includes the years 2015 to 2021 and the months April to September. Averaged annual yields of the respective comparison areas serve as the target value for training the machine learning approaches. Three main research questions were addressed in this work: 1. Can annual yield serve as an indicator for drought in grassland areas in Saxony? 2. is it possible to estimate the annual yield of grassland using satellite indices from Sentinel-2 data used for drought monitoring and the SPI? 3. Can machine learning, especially random forest and support vector regression, be used for yield estimation? For estimating missing values, due to cloud cover for example, two methods were used. On the one hand, rfImpute from the randomForest package and on the other hand bagImpute from the caret package in R were used. The results with the test dataset of the two machine-learning approaches, which includes all grassland areas of the four study sites in 2018, give an RMSE of 12.57 dt/ha and 11.25 dt/ha with the best tuning parameters at absolute yields between 26.75 dt/ha and 42.55 dt/ha. With the present results of this work, the research questions could not be answered sufficiently. Some model improvements are recommended. Among them, the use of grassland yields with a higher spatial and temporal resolution for training and the use of indices with a lower correlation among them.

Performance result of an RF model
- External PhD student at the Max Planck Institute for Biogeochemistry Jena, co-supervised by Matthias Forkel
- Website at MPI-BGC
- Dissertation: Terrestrial vegetation-water interactions in observations and models https://nbn-resolving.org/urn:nbn:de:bsz:14-qucosa2-879330
- Defense: 05.06.2023
Comparison of flooding area mapping algorithms using Sentinel-1 data
Study
MSc Geoinformation Technologies
Date of defence
03.05.2023
Supervisor
Matthias Forkel, Sebastian Goihl (LfULG)
Abstract
In this master thesis, a comparative analysis of flood mapping algorithms using Sentinel-1 data is conducted, focusing on Mean Thresholding, Otsu Thresholding, Multi-Otsu Thresholding, and the Random Forest (RF) machine learning algorithm. The primary objective of the study is to evaluate the effectiveness and accuracy of these algorithms in detecting and mapping flood-affected areas. The regions studied include the Ahrtal and Sauer and Kyll river valley regions in Germany, with the data divided into separate parts for model training and validation. An extensive literature review was performed using the Web of Science database to identify relevant studies and methodologies employed in flood mapping using remote sensing data. The performance of each algorithm is assessed through accuracy, Kappa coefficient, and other evaluation metrics. A comprehensive dataset, including Sentinel-1 data and terrain and hydrological metrics, is employed for model training and validation. The results indicate that the Random Forest algorithm outperforms the thresholding methods, with higher accuracies and improved overall flood detection capabilities. This thesis provides valuable insights into the applicability of different flood mapping algorithms using Sentinel-1 data and offers recommendations for selecting appropriate methods for specific flood scenarios. The findings contribute to the growing body of knowledge on flood mapping using remote sensing data and support decision-makers in disaster management and mitigation planning.
Evaluation of the competence to identify deep fake satellite images
Study
Bachelor Geodesy and Geoinformation
Date of defence
21.04.2023
Supervisor
Christine Wessollek, Lucas Kugler
Abstract
Due to current tensions in international security policy, the discussion about fake satellite images not only concerns experts and politicians, but also increasingly the general public. The presented work makes an empirical contribution to this discussion and illustrates that the dangers posed by the falsification of satellite images using generative neural networks must be taken seriously. Therefore, it is even more important that the fake satellite images are reliably detectable. Specifically, the purely visual detection of the deep fakes is evaluated in this work. Additionally, the influence of competence on the detection result is also investigated. To answer the research questions, based on self-generated deep fake satellite images, a survey was conducted and a technical approach to detect the generated deep fakes was developed. The survey showed that fake satellite images are not reliably detectable and competence has no influence on the detection results. On the other hand, the technical detection approach can efficiently expose fakes. The results illustrate the dangers of deep fakes. It is therefore important to raise the awareness of the dangers and to develop continuously these detection methods so that deep fakes can also be reliably detected in the future.
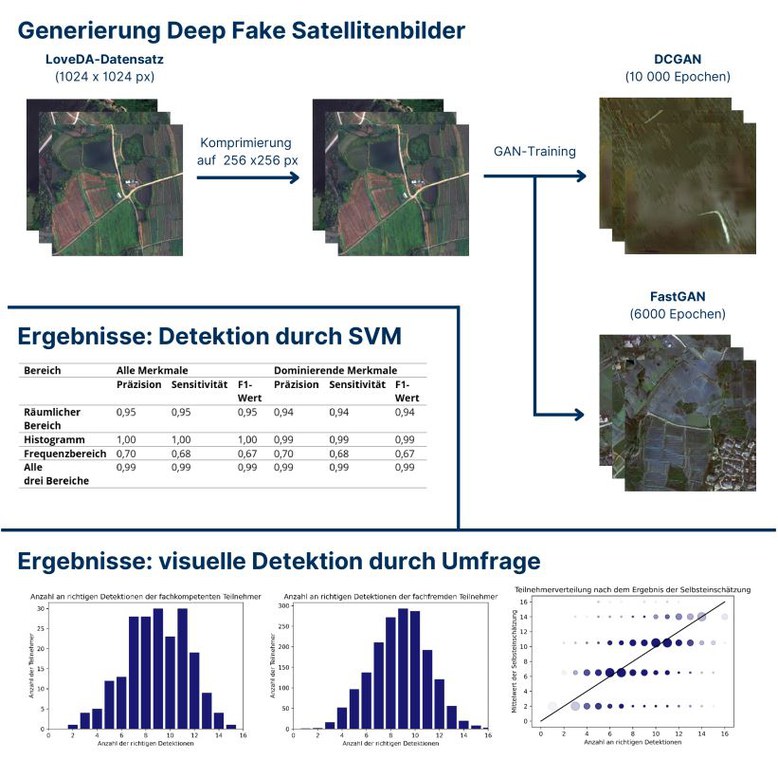
Graphical abstract
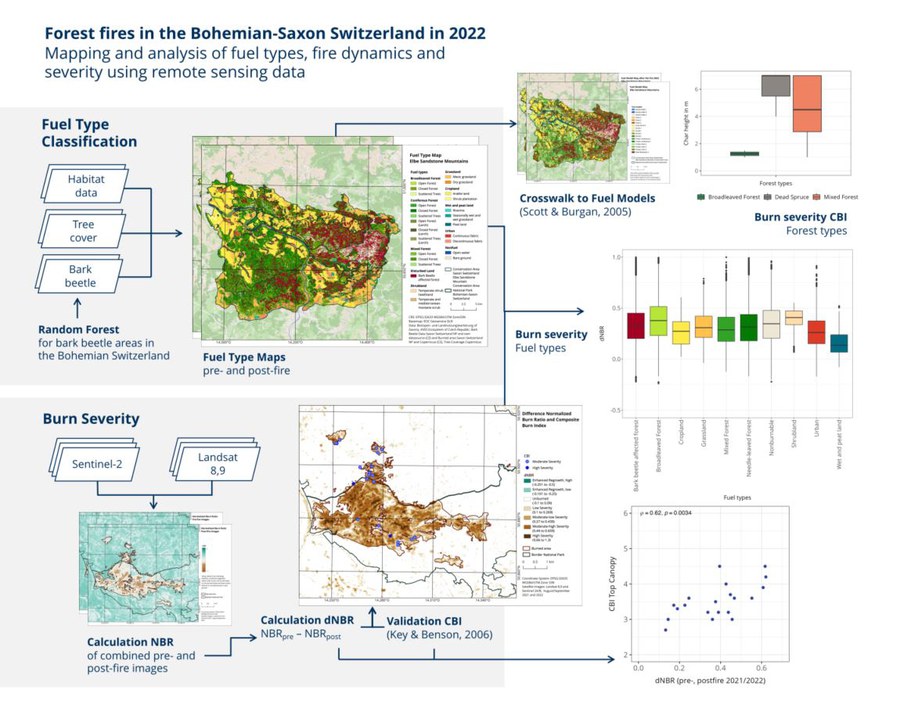
Forest fires in the Bohemian-Saxon Switzerland in 2022: Mapping and analysis of fuel types, fire dynamics and severity using remote sensing data
Study
MSc Geoinformation Technologies
Date of defence
23.03.2023
Supervisor
Matthias Forkel, Dr. Annika Busse (Nationalpark Sächsische Schweiz)
Abstract
The forest fires in Bohemian-Saxon Switzerland in 2022 demonstrated the need for comprehensive fire research and management strategies in the National Parks to better understand the main drivers and to predict fires and fire behaviour in the future. The developed fuel type classification and mapping in the study area and the crosswalk to the Standard Fire Behaviour Fuel Models from Scott and Burgan (2005) set the basis to analyse fire behaviour in different fuel types and can be further employed in fire models like FlamMap. For the fuel type mapping, the classification scheme of Aragoneses et al. (2022) and the Alaska Fuel Model Guide Task Group (2018) was combined and adapted to the study area using different input data sets: habitat data covering both National Parks, tree coverage data from Copernicus and bark beetle-infested forest data. For the bark beetle-infested forests in the Bohemian Switzerland National Park, a Random Forest model was built and trained with the corresponding bark beetle data from the Saxon Switzerland National Park and the bands of a Landsat 8 image as well as the Normalized Burn Ratio (NBR), the Normalized Difference Vegetation Index (NDVI) and the Normalized Difference Moisture Index (NDMI) as predictor variables. Particular focus is set on the influence of bark beetle-infested forests since it is widespread over the National Parks and the fuel type that burned the most (41%). The green band and the NDMI had the strongest influence on the model and an overall accuracy of around 90% was achieved. Also, the burn severity is estimated by the Difference Normalized Burn Ratio (dNBR) through Landsat 8, 9, and Sentinel-2 images, resulting in moderate burn severities. For the calculation of the dNBR, the difference from the NBR pre-fire image to the NBR post-fire image is taken. Therefore, satellite imagery from mid-August and September 2021 and images from the same period in 2022 after the fire were employed. To validate the dNBR, 21 field surveys were undertaken to measure the Composite Burn Index (CBI), in September and the beginning of October 2022. Significant correlations (r = 0.62, p < 0.01) have been found with the Spearman correlation coefficient when evaluating the relationship between dNBR and the CBI upper canopy (strata D and E). No correlation was found between the CBI (all strata) and dNBR. However, the CBI understorey strata revealed higher burn severities, which the passive sensors could not detect. The burn severity dNBR was highest in dead spruce stands and other forest fuel types. Dead spruce stands indicated especially high char heights and torching in the field caused by the high amount of dead and dry fuel when compared to broadleaved and mixed forests.
Graphical abstract
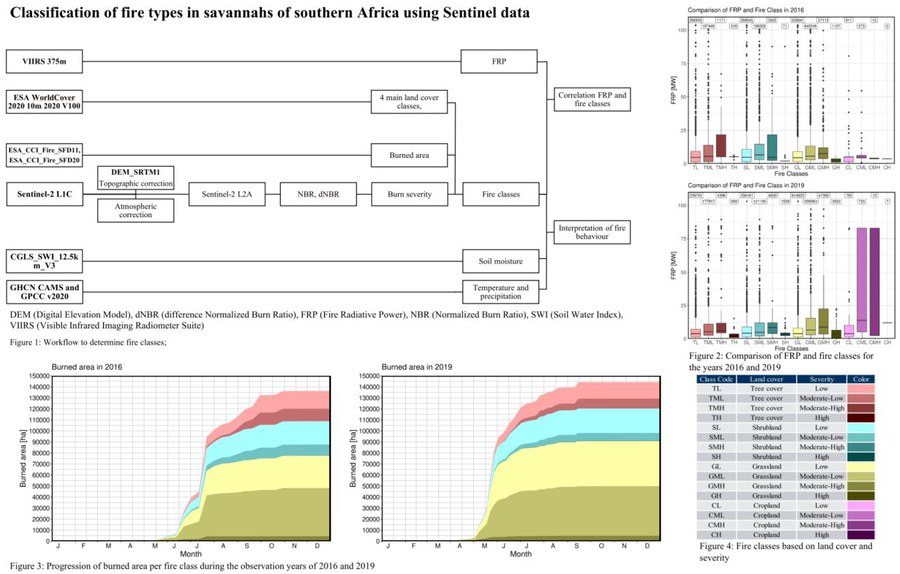
Classification of fire types in savannahs of southern Africa using Sentinel data
Study
MSc Geodesy
Date of defence
20.01.2023
Supervisor
Dr. Christine Wessollek, MSc. Tichaona Tavare Mukunga (TU Wien, Department of Geodesy and Geoinformation)
Abstract
Fires are a part of the natural process in savannah areas. It is estimated that 300-1600 Teragram Carbon (TgC) per year are released by these fires. To analyse these fires regarding the land cover type and burn severity, a fire classification method was developed based on the use of land cover datasets and Sentinel-2 data. In order to do this, the ESA WorldCover 2020 land cover model was selected in an observation area in Zambia and compared with the ESA CCI LAND COVER - S2 prototype 2016. This observation area had an extent of 14.8°-15.2°S and 25.7°-26.1°E and contained all of the four main land cover types representative of savannah, tree cover, shrubland, grassland and cropland.
After selecting the first data to be used for classifying the fires, the Sentinel-2 data was processed from L1C to L2A using the processing software FORCE by David Frantz. In addition to atmospherically correcting the Sentinel-2 data, the data was topospherically corrected using the DEM_SRTM1 dataset. The difference Normalized Burn Ratio (dNBR) was then calculated from the Sentinel-2 L2A data as the difference between the Normalized Burn Ratio (NBR) before and after fires. From this, the burn severity was determined as a measure of fire effect levels for burned area based on the method of Key and Benson.
From the land cover and fire severity, sixteen fire classes were defined. These fire classes were then evaluated qualitatively by comparing the results with corresponding climate and soil moisture data. It became evident, that the yearly progression of fires was linked to the precipitation and the corresponding soil moisture of the previous months. In addition, the relationships between these fire classes and the Fire Radiative Power (FRP) were analysed. For this purpose, VIIRS 375m FRP data were compared with the individual fire classes for each year. From the data it became evident, that higher severity in the classified fires corresponds to higher FRP values. Overall, a classification of the detected fires was achieved and the results of which were found to be compatible with available weather and soil moisture data. Furthermore, a correlation between the different fire classes and the measured FRP was determined.
Graphical abstract
Comparing the German Forest Fire Danger Index and medium-resolution satellite Products for the Quantification of Fire Occurrence in central Europe
Study
MSc Geoinformation Technologies
Date of defence
13.01.2023
Supervisor
Matthias Forkel, Dr. Dirk Pflugmacher (Humboldt-Universität zu Berlin), Christopher Marrs
Abstract
In this work, the German Forest Fire Danger Index (WBI) was investigated and compared with two Random Forest (RF) classifier models, that aim to predict the forest fire occurrence probability. These models were trained with remote sensing data and past fire events from the year 2020. Specifically, satellite data about the Leaf Area Index (LAI), the Land Surface Temperature (LST), the Surface Soil Moisture (SSM), the Soil Water Index (SWI) as well as other static spatial data about forest type, forest height, slope, aspect, day in the year of the fire event and population density were integrated. The first model included variables which were linked to the WBI, to create comparability. The second model included additional parameters that provide information about the fire ignition.
The evaluation of the WBI, with information on past fire events, burned area, land cover and its causes showed that the WBI does not warn according to its highest fire danger class. Furthermore, the WBI danger classes do not show distinct values in the satellite variables, which means that the warning levels cannot be clearly distinguished from each other. The results of the RF models predicting fire occurrence have an accuracy of 0.67 and 0.71, which can be rated as good.
Colouring and interactive visualization of historical Earth observation data
Study
MSc Cartography
Date of defence
23.09.2022
Supervisor
Matthias Forkel, Mathias Gröbe, Lucas Kugler
Abstract
In the 1960s, the US launched a series of satellite projects aimed at building a reconnaissance system. The CORONA project was in operation between 1960 and 1972. During the operation, a large number of satellite images were taken. Until 1995, these images remained classified. Since 1995 numerous researchers have exploited the CORONA images, primarily to study surface cover changes across the globe. This study adapts the existing DeOldify model, which is dedicated to colourising images to specifically colourise CORONA satellite images through retraining the model using the CORONA image dataset. The CORONA image dataset consists of greyscale CORONA images and colour reference images covering the same region and having little or no change in the image content. A generative adversarial network is used for building this model. A U-Net-based generator network and a binary-classifier-based critic network train in an alternative approach. To improve the training efficiency, transfer learning and NoGAN training techniques are implemented. The generated images are evaluated both quantitatively, using RMSE and PSNR, and qualitatively, using a user study asking the participant if the displayed colour image looks natural. Results show that generated images with good performance using RMSE and PSNR do not necessarily have plausible colours. Compared with the original DeOldify model, the retained model can produce images with more natural and plausible colours, achieving a result of 70.1% of the participants thinking they are real, although these images have poorer reconstructing quality. To visualise the results, a web mapping application is developed with Geoserver and Leaflet. The server stores data and publishes it through WMTS or WFS. Cache service and image pyramid are used to accelerate the response on the client side. The web map client provides an interactive map interface for the users to control the displayed layers and download the selected layer in a self-defined ROI through WPS.
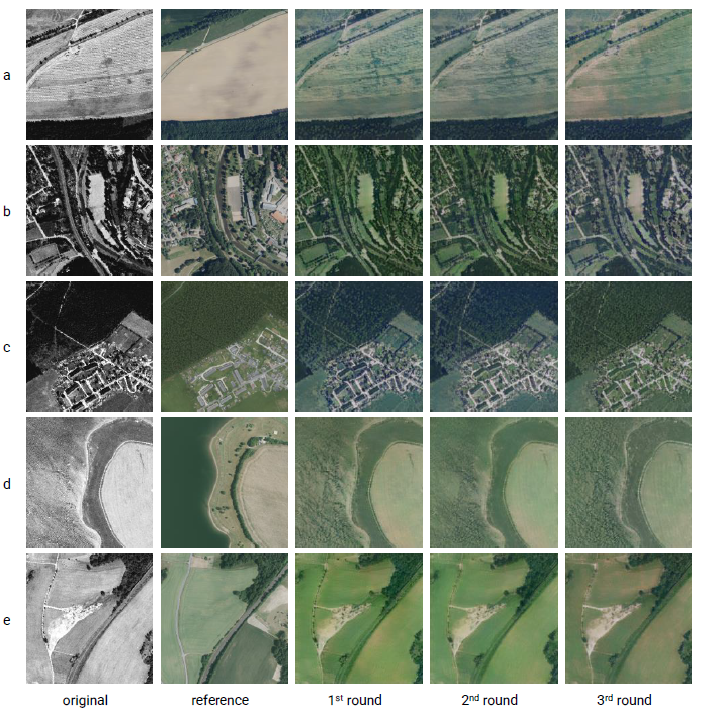
Selected samples from each round of NoGAN training
Differentiation of Calluna vulgaris in seed germination and stock sprouting in the Kyritz-Ruppiner Heide in relation with maintenance activities
Study
MSc Spatial Development and Natural Resource Management
Date of defence
14.04.2022
Supervisor
Matthias Forkel, Dr. Carsten Neumann (GFZ Potsdam)
Abstract
The loss of biodiversity is evident in many areas. It is becoming increasingly visible and has many faces, with human influence playing a significant role. Humans are reshaping the planet through immense changes in land use. This influence also contributes to the preservation and creation of new ecosystems. Heathlands are an example of the (un)conscious action of humans, as this habitat was created and shaped by traditional human management. However, this habitat is now also under threat, as traditional agriculture has given way to industrial agriculture and management techniques have changed as a result. It was precisely these that ensured the resilience and thus the preservation of the habitat. Meanwhile, many of the heathland areas are over-aged and in poor to very poor condition. The 2019 FHH report additionally states that their condition will continue to deteriorate (BFN, 2019). The preservation of these habitats is thus dependent on human care.
The promotion of maintenance measures to rejuvenate the heather (Calluna vulgaris) stands is essential to build up a better structure and thus resilience of the entire habitat. The distinction between seed germination and re-sprouting is relevant here (Watt, 1955; Whittaker & Gimingham, 1962; Miller & Miles, 1970; Webb, 1986).
To distinguish between these vegetation types, it was hypothesised that there are differences in growth and flower formation. To validate this hypothesis, areas in the Kyritz-Ruppiner Heide were maintained by burning and mowing. The re-sprouting was recorded by means of regular drone recordings, which serve as data basis for this work. By using different indices, a classification of the individuals heather plants took place, which allowed conclusions to be drawn about the variables: area size, growth difference and flower formation. Based on the assumption that Calluna seedlings have a lower growth rate than re-sprouts, differences in area size and growth height can be assumed. Due to these dynamics, a later and shorter flowering period can also be assumed. Threshold values in the growth dynamics could be identified by means of stepwise adjustment of the variables and subsequent data analysis. In addition, links between flowering periods, growth periods and maintenance measures were identified. Natural areas created by humans develop through and with the influence of humans. To protect and maintain the biodiversity of these habitats, various measures are needed.
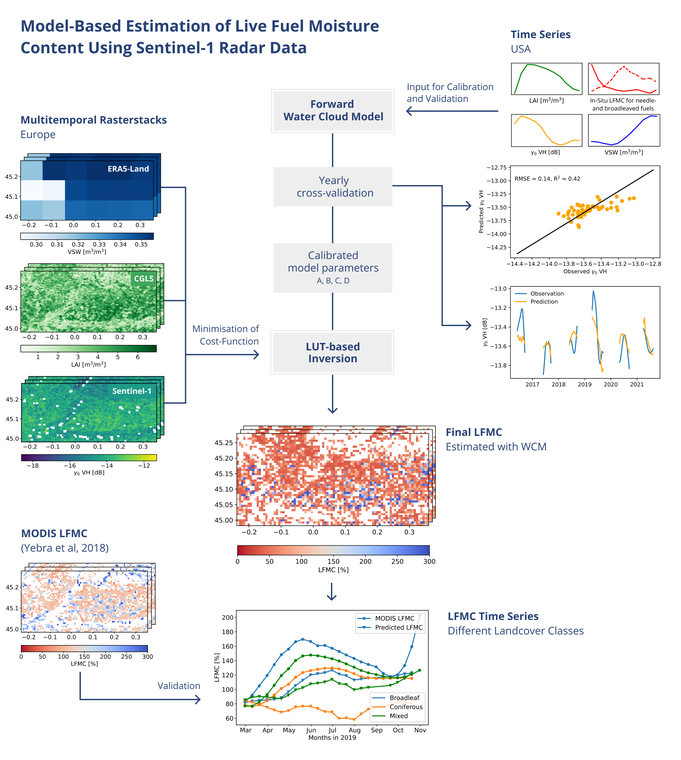
Model-based estimation of Live Fuel Moisture Content with Sentinel-1 radar data
Study
MSc Geoinformation Technologies
Date of defence
04.04.2022
Supervisor
Matthias Forkel, Dipl.-Ing. Ruxandra-Maria Zotta (TU Wien, Department of Geodesy and Geoinformation)
Abstract
The assessment of wildfire risk is of great importance worldwide, not least because of climate change. One important risk indicator is the live fuel moisture content (LFMC) defined as the ratio between plant water content and dry biomass, since a higher water content of vegetation decreases the probability of fire ignition and the speed of fire propagation.
Several studies demonstrated the potential of optical satellite data to estimate LFMC at the regional and global scale. However, since the use of optical sensors is limited by atmospheric influences and cloud coverage, microwave satellite data offers a potential alternative. This thesis focused on the potential of Sentinel-1 radar data for the retrieval of LFMC by modifying the approach of Wang et al. (2019), which combines the water cloud model (WCM) and a linear bare soil backscatter model. Since the above-mentioned approach does not consider influences of changes in biomass, vegetation structure and soil moisture on the radar backscatter, biophysical variables of vegetation and soil-related parameters were introduced as additional input in the WCM with the aim to assess their impact on the model’s accuracy. The model was first trained and validated with in-situ measurements available for study sites in the United States of America and subsequently transferred to forest locations in Europe, where LFMC measurements are few.
Using the additional variables, LFMC ground measurements, leaf area index (LAI) and volumetric soil moisture (VSW), the modified WCM was able to accurately simulate the contributions of soil and vegetation to the total radar backscatter. Compared to VSW, LAI exerted a stronger influence on model performance (R2) during the calibration process. To invert the model for the estimation of LFMC, an optimised look-up table (LUT) was built by running the WCM forward using all possible combinations of a predetermined range of values for the input variables. The inclusion of LAI and VSW in the minimisation of a cost function, used to retrieve the optimal LFMC from the LUT, enabled the transfer of the WCM to Europe, since the model accuracy depended primarily on relations between backscatter, LAI, LFMC and VSW. The relations were found to vary with the heterogeneity in prevalent vegetation species and the fraction of vegetation coverage. The derived LFMC values were classified into coniferous, broadleaved and mixed forest, and then validated with the MODIS LFMC product based on the algorithm by Yebra et al. (2018). Promising results for root mean square error (RMSE = 25 %, 26%) and coefficients of determination (R2 = 0.50, 0.42) were obtained for deciduous and mixed forests, while the WCM resulted in higher inaccuracies for coniferous forests (RMSE = 45 %, R2 = 0.17).
Predicting spatial patterns of forest fire using random forest machine learning algorithm in the Terai Arc Landscape of Nepal
Study
MSc Tropical Forestry and Management
Date of defence
14.01.2022
Supervisor
Matthias Forkel, Mir A. Matin
Abstract
Increasing forest fire events present novel challenges to forest ecosystems and human well-being. Early detection of forest fires and understanding interrelationship between forest fires and forest fire driving factors are considered important for effective fire management. Unerstanding the perception of decision-makers of existing fire management infrastructure and initiatives is equally important in order to implement preventive measures. We used VIIRS fire dataset (2012-2021), climatic, topographic, and infrastructure predictor variables aggregated over time to generate a fire susceptibility map from random forest (RF) machine learning algorithm. A key-informant questionnaire survey was also undertaken with the forestry professionals working in the TAL region to understand their perception of existing fire management initiatives. RF model achieved an overall accuracy of 72.8% and a sensitivity value of 88% in the evaluation dataset indicating a good predictive ability of fire occurrence. Most parts of the TAL region were susceptible to fire. Our findings of increased fire risk in some districts located at the south-west and north-east part of the TAL were unique to the findings of previous fire-related studies in TAL. Fire occurrence was lowest in 2020 (0.42%) followed by sharp increase in 2021 (19%). Broad-leaved forests were highly susceptible to fire. An increased number of fire events were observed with high temperatures. Fire events were higher in proximity to roads and settlements. Respondents were of the opinion that there is a need for effective management initiatives to improve existing quality and condition of fuel management infrastructure and fire management initiatives. These findings will assist in in the effective decision-making process of fire prevention and suppression reducing the potential future damage due to forest fires in the TAL region of Nepal.
Comparison of deep learning model structures for land cover classification using historical Corona satellite imagery
Study
MSc Geodesy
Date of defence
05.01.2022
Supervisor
Matthias Forkel, Philipp Körner
Abstract
Climate is strongly influenced by the characteristics of land cover, where water, energy and trace gases interact directly with the atmosphere. It is therefore not surprising that a change in land cover also causes a change in local climate and material cycles. Remote sensing has played a fundamental role in continuous earth observation and land cover change detection — at least since the launch of the Landsat satellite program (1972). In 1995, the Central Intelligence Agency from the United States of America released previously secret spy satellite images. These images are pan-chromatic satellite images taken from 1960 onwards with near-global coverage. The satellite images are particularly interesting because they contain information about land cover from 10 years before the beginning of civilian Earth observation. Nevertheless, there are a scarcely studied data source to date. Building on initial approaches, the present work investigates applying different neuronal networks to automatically extract land cover from CORONA data. The particular focus of the work is on the transferability of the approaches to unknown CORONA data. In the long term, the landscape cover is to be extracted from CORONA data on a large scale. To investigate the transferability, seven spatially and temporally distributed test areas in the the federal state Saxony, Germany were selected for cross-validation.
In the present study, a total of four different U-Net architectures were used. A U-Net is a deep neural network for semantic segmentation of image data. All four architectures have different capabilities and are optimised for different land cover classification challenges. As input three different image compositions. The first compostion is the original pixel values (one channel), the second is the GLCM texture measures (ten channels). The third composition is a simulated RGB image (three channels). These three compositions were combined into one image with 14 channels. In addition, semantic masks were created for all test areas to serve as reference data. For this purpose, the landscape coverage was divided into six classes. From these input data, seven different training datasets and test
datasets were derived for cross-validation. Based on the training datasets — four archi-
tectures were trained for each test area and then applied to the corresponding test data.
Resulting from the training it could first be deduced that a classification of land cover from
CORONA data with the used architectures is possible. In all test areas, all architectures
achieved a training IOU above 85%. Poor to moderate IOU values were achieved for the
individual test areas. The best mean segmentation accuracy is 30.50%, while the worst
value for a test area is 12.71%. Strong accuracy variations were detected among the classes. Classes that have a lot of sample data achieve significantly better IOU values than
underrepresented classes. The best segmentation performance, with an average IOU of
54.51%, was obtained for the agricultural land class, closely followed by forest with 52.80%. For the classes shrub vegetation, open areas and water bodies mostly only IOU
values below 10% were achieved. For classes with many sample data, moderate to good segmentation accuracy was achieved for both spatial and temporal transferability. Since
the data set does not cover all factors for generalised transferability, transferability could
only be ensured under certain framework conditions. For example, the study does not
cover handling of clouds or CORONA data of poor quality.
As a conclusion it was recognised that a combination of results from different architectures might improve the outcome. As a outcome, it was recommended to consider this issue for further developments.
Assessing the Spatial Variability of Above-ground Forest Carbon using Sentinel-1, Sentinel-2 and Field Inventory Data of the Miombo Woodlands in Songwe District, Tanzania.
Study
MSc Tropical Forestry
Date of defence
29.11.2021
Supervisor
Matthias Forkel, Hamidu Seki ( University of Dar es Salaam - Mkwawa University College of Education, Tanzania)
Abstract
Accurate estimates of above-ground biomass and carbon (AGC) are needed to understand the role of forests in the global carbon cycle. To achieve this, recent forest monitoring and assessment techniques now rely on integrating remote sensing and field inventory data to map and monitor carbon changes in tropical forests. More importantly, AGC spatial distribution is intricately linked to climate, soil, topography, and anthropogenic disturbances, whose influences should be understood so that their spatial effects are utilised to sustain forest carbon. Hence, this study combined Sentinel-1 and Sentinel-2 variables with field inventory data in a generalised additive model (GAM) to map the Tanzanian Miombo AGC while explaining its spatial variability. Fifteen (15) models were trained and tested using the leave-one-out cross-validation in GAM. Model 6, containing selected predictors – B11 (Shortwave Infrared 1), NDVI (normalized difference vegetation index) and tree canopy cover (%tcc), indicated best prediction accuracy (R2 = 0.87) with the least error (RMSE = 5.24 tC/ha) and an upper bound prediction of 114.87 tC/ha. A combination of Sentinel-2 variables (B11 & NDVI) and %tcc are better predictors for mapping AGC in the study area. Overall, the spatial drivers explained 65.5 % of AGC spatial variability with elevation having the highest predictive power (21.65 %), followed by mean annual temperature (MAT; 21.10 %), the interaction effect of elevation and distance to settlement (20.99 %), distance to settlement (18.24 %) and silt content (18.02 %). The study also showed that AGC increases with increasing elevations and silt content and decreases with increasing MAT and distance to settlement. More so, AGC increases accordingly with increasing interaction effect between elevation and distance to settlement. Therefore, understanding the impact of these factors on the distribution of AGC will be necessary for adequate forest planning and management.
Predicting, understanding, and visualizing fire dynamics with neural networks
Study
MSc Cartography
Date of defence
22.11.2021
Supervisor
Matthias Forkel, Tichaona Tavare Mukunga MSc. (TU Wien)
Abstract
As machine learning techniques are contributing to scientific research and advancement, the interpretability and visualisation of these algorithms grow in importance. These techniques have introduced many improvements to advance our understanding of fire regime dynamics outperforming process-based approaches. Neural networks have achieved great accuracy with fire modelling, however, challenges arise with unbalanced time series. In this thesis, LSTM neural networks, which are designed for sequence modeling and handling unbalanced data, are investigated to explore their ability to predict fire ignition points. The research is conducted for a small area in western Africa using monthly meteorological variables and fAPAR as an indicator for vegetation for a period spanning from 2003 to 2016. The chosen methodology is based on training one LSTM for each pixel independently. Datasets are pre-processed, structured as a multivariate time series and then arranged to fit LSTM 3D data format. The network architecture was chosen by conducting multiple experiments. The pixel-based LSTM was able to capture the seasonal and spatial varieties with RMSE value computed at 3.333. However, it underestimated the high values of ignitions during the peak of fire season and was not able to record sudden events. To better understand LSTM behavior, multiple interpretation techniques were investigated to evaluate their abilities to determine the most important features and visualise their dependencies. Permutation feature importance gave an overview of overall feature importance while variance-based feature importance was able to map the spatial distribution of each feature. SHAP summary plots gave a detailed interpretation of feature importance of precedent time steps. The most important features to predict fire ignitions were found to be fAPAR, precipitation and maximum temperature. Recent conditions were found more important north of the study area, whereas, in the middle and southern regions, precedent year conditions were of higher importance. SHAP dependence plots were able to depict feature-output relationships. Using these plots, it was observed that LSTM represented the fire-predictor relationship correctly only for a few variables. For feature interactions, a 3D extension of SHAP dependence plot with added color visual variable was found to be the best visualisation technique. Visualisation of LSTM helped with understanding how the model is learning and which variables were modelled correctly. From here, further improvements could be applied leading to increasing trust in machine learning approaches.
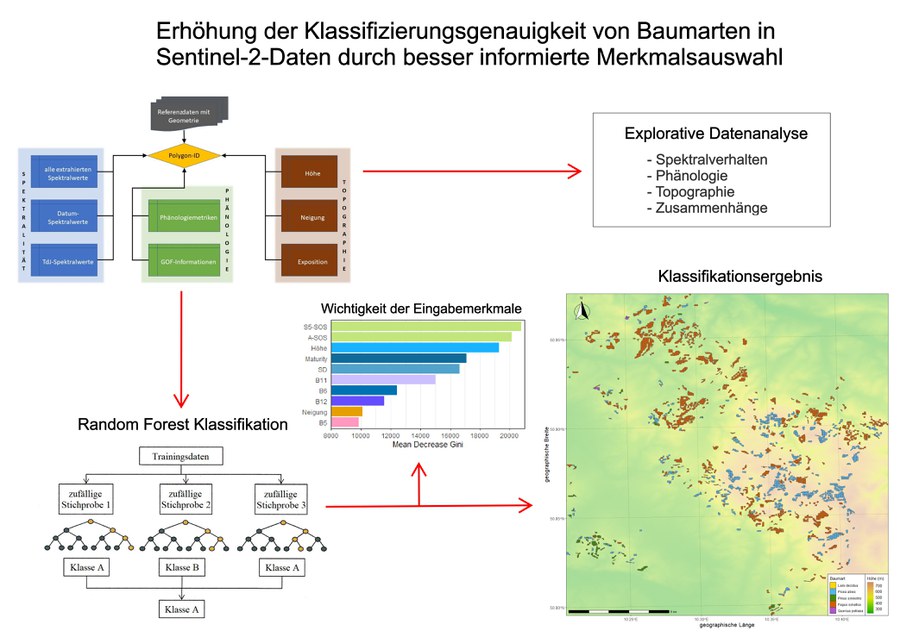
Increasing the accuracy of tree species classification in Sentinel-2 data through better informed feature selection
Study
MSc Geoinformation Technologies
Date of defence
15.10.2021
Supervisor
Matthias Forkel, Dzhaner Emin (iABG mbH)
Abstract
The tree species composition of forests plays a central role in sustainable forestry and nature conservation. With the help of multispectral remote sensing data and machine learning methods, tree species can be classified objectively and over a wide area with good results, as previous studies have shown. The aim of this master thesis is to increase the classification accuracy for tree species based on Sentinel-2 data using informed feature selection. The classification is based on inventory data of Thuringia, and the study area is located in western Thuringia and the five most common tree species there are classified. To increase the classification accuracy of the tree species, their spectral behaviour, phenology and topography are included in the classification. For this purpose, the Sentinel-2 scenes were first preprocessed with the free processing software FORCE and the spectral and phenological features were then derived from the Sentinel-2 time series and the topographic features from the SRTM-DEM. These were then used to conduct an exploratory data analysis to better understand the relationships between tree species and their species-specific characteristics, especially to gain insights for their classification. Finally, the tree species were classified in different random forest models with their spectral, phenological and topographic features and the importance of these features for their differentiation was determined using the "Mean Decrease Gini". The investigations show that the integration of the phenological and topographical features increased the classification accuracy by about 5 percent to 90 percent. The most important input features include the phenological features of the beginning and peak of the growing season, as well as the elevation and spectral bands of the SWIR. By applying a "second majority vote" on the different values of the spectral features, the classification accuracy could even be increased by several percent. The developed workflow for tree species classification and the gained knowledge should serve as inspiration for future tree species classifications and help to better understand tree species characteristics.
Graphical abstract
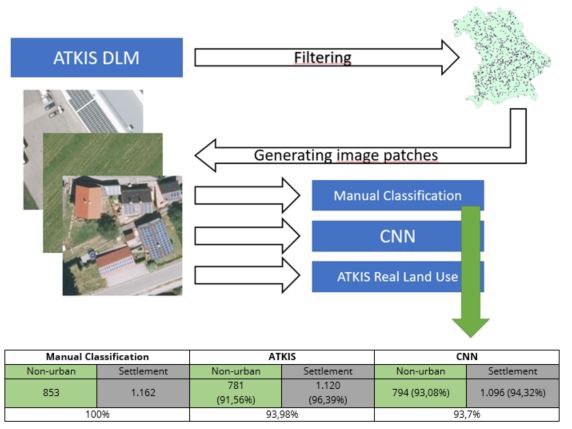
Evaluation of the real land use in ATKIS with digital orthophotos and convolutional neural networks
Study
MSc Geoinformation Technologies
Date of defence
08.10.2021
Supervisor
Matthias Forkel, Gotthard Meinel (Leibniz Institute of Ecological Urban and Regional Development)
Abstract
The ATKIS-Basis-DLM is one of the most important databases in Germany regarding the modelling of the earth's surface. Based on the attribute "Real land use", numerous sustainability indicators are calculated in the IÖR-Monitor of the Leibniz Institute of Ecological Urban and Regional Development. However, there are still no reliable data on the quality of the Real land use.
The aim of this thesis was therefore to determine the quality of the recording of the Real land use in ATKIS. Regarding a possible automation of the process, it was tested in parallel whether and to what extent machine learning methods are suitable to take over this task. For this purpose, an artificial neural network was programmed to determine the Real land use based on high-resolution ortho-air images.
The starting point of the investigations was a manual classification of the Real land use in a randomly selected sample of 1,000 aerial images from the years 2012 and 2019. The basic selection of the sample was based on four different types of land use from the categories of non-urban and settlement. Both ATKIS and the neural network were compared with the manually created reference. It was found that ATKIS had the correct Real land use in 93.98% of cases examined. The neural network was able to detect the correct usage in 93.7% of cases. The general weaknesses of the two products are partially complementary to each other, so in the future a combined procedure could be developed to improve the quality of the Real land use in ATKIS.
Graphical abstract
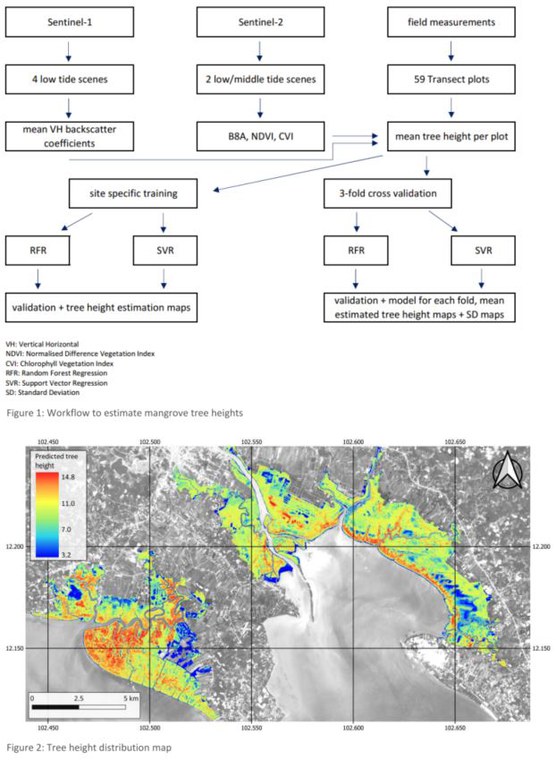
Estimating tree heights from mangrove forests using machine learning algorithms on combined Sentinel-1 and Sentinel-2 data
Study
MSc Geoinformation Technologies
Date of defence
30.09.2021
Supervisor
Matthias Forkel, Uday Pimple (King Mongkuts University of Technology, Thonburi, Thailand)
Abstract
Mangrove forests are highly productive ecosystems that also offer coastal and inland protection against natural hazards such as tsunamis or hurricanes. As they are also one of the most threatened ecosystems, several projects now focus on natural regeneration and rehabilitation of formerly destroyed mangrove forests. With mangrove tree height, monitoring, regeneration and rehabilitation efforts can be observed and optimised as well supporting the estimation of above-ground biomass and analysing health status and effectiveness of CO2 sequestration. Furthermore, tree heights can be used as a level of protection against natural hazards. Field measurements in Trat, Thailand, resulted in three transect lines that run perpendicular to the coast and consist in sum of 59, 10 m × 10 m, plots containing the mean tree height per plot. With two Sentinel-2 scenes, the spectral vegetation indices Normalised Difference Vegetation Index (NDVI) and Chlorophyll Vegetation Index (CVI) were calculated as well as the red-edge band "B8A" was extracted for the analysis. Mean Vertical-Horizontal (VH)-backscatter coefficients of four low tide ground range detected Sentinel-1 scenes support the Sentinel-2 variables as independent observations for a Random Forest Regression (RFR) and a Support Vector Regression (SVR). A site-specific division into training and test plots resulted in meaningful validation results with Root Mean Squared Errors (RMSE) of approx. 1.60 m and two models that can be used to estimate mangrove tree heights of the entire mangrove forest in Trat. A tree height distribution map shows that vertical structural diversity varies along the intertidal zones. Additionally, a three-fold cross validation gave an overview of possible accuracies that a model can achieve, depending on the selection of training and test samples. When calculating the average tree height from the estimations of all three models from each fold, a standard deviation (SD) map can reveal prediction errors. Especially the RFR-SD map was able to detect uncertainties because of clouds in a used Sentinel-2 scene. A comparison of the mangrove tree height distribution map with a species distribution map revealed that regeneration efforts in Trat were successful.
Graphical abstract
Estimating high-resolution land surface temperature by integrating Landsat-8, Sentinel-1 and Sentinel-2 using a Random Forest algorithm
Study
MSc Geodesy
Date of defence
20.09.2021
Supervisor
Matthias Forkel, Anette Eltner
Abstract
Land Surface Temperature (LST) observations enable a better understanding of the ecosystem since LST is connected to water, energy and carbon fluxes. A couple of satellite systems provide relevant information for the calculation of LST using thermal infrared (TIR) bands. However, the data is available either at high spatial or temporal resolution which disables monitoring approaches at small scale. In order to fill the gap between the spatial and temporal resolution, downscaling algorithms have been developed, reaching a spatial resolution of 30m. The aim of this master thesis is to develop an algorithm that is able to contribute higher spatial resolution of 10m getting closer to monitoring approaches at small scale. The combination of both Sentinel-1 (S1) and Sentinel-2 (S2) data is a promising benefit since both contribute high spatial resolution. Further, S1 data is sensitive to the water content in vegetation and therefore correlates with LST. Together with a digital elevation model (DEM), features derived from S1 and S2 serve as predictors in order to train a Random Forest model. Four strategies were tested, each consisting in a set of features, an evaluation method and a specified training and target resolution. The first strategy uses the same satellite scene at different spatial resolution. Therefore, a Random Forest model trains features against Sentinel-3 (S3) LST at 1000m, while it is tested against Landsat-8 (L8) LST at 30m. Spatial Cross Validation (SCV) serves as evaluation method in all other strategies, separating the study area into four subsets. In doing so, they train a Random Forest model where the training dataset holds three subsets while the remaining one acts as testing dataset. These strategies are conducted with data at 1000m on the one hand and on the other with data at 30m spatial resolution. Since the datasets at 30m are trained against L8 LST, S3 LST is included as feature in one of the strategies. Best results were achieved with spatial cross validation at 30m resolution containing B12, DEM, NDVI, NDWI, SRWI and S3 LST as feature. Comparing predicted and observed LST, the Root Mean Square Error (RMSE) is 1.62K while the coefficient of determination (R2) is 0.73 and the correlation coefficient amounts to 0.86. In general, the trained Random Forest model tends to predict lower temperatures for urban areas and higher ones for forests. Features derived from S1 do not improve the results. The reason could be found in different acquisition times of the data or that other research use soil moisture derived from S1 backscatter instead of S1 observations themselves. However, spatial cross validation was not found to be well suited as evaluation method and could have an impact on the results making them less reliable. The outcomes also present that some information is missing to fully explain the relationship between LST and features. To solve this issue, other combinations of features and the addition of new ones, e.g. soil moisture, fractional green vegetation cover and air temperature, should be considered.
Assessing environmental controls on phenology with dense Landsat and Sentinel-2 time series in Andean Araucaria forests of Chile
Study
MSc Geodesy
Date of defence
19.08.2021
Supervisor
Matthias Forkel, Jaime Hernández (Universidad de Chile)
Abstract
Araucaria araucana, commonly called “monkey puzzle tree”, is an endemic, evergreen conifer native to the temperate woodlands of the South American Andes and has a high cultural importance for indigenous tribes and Chilean identity. It typically occurs together with several southern beech species (Nothofagus spp.), forming the characteristic Araucaria-Nothofagus forests. Human exploitation and lack of preservation have led to widespread landscape fragmentation in south-central Chile and Argentina, their only natural habitat. The effects of ongoing climate change are another major threat to the forest ecosystem. Analysing the phenological traits of terrestrial vegetation is one of the key factors in assessing long- and short-term trends of plant growth. However, no detailed study has ever been conducted that investigates the phenology of Araucaria forest stands. In this master’s thesis, the natural phenological variability of undisturbed Araucaria forests in a Chilean national park was analysed between 2016 and 2020 using high-resolution satellite imagery. Dense NDVI and EVI time series of Landsat 8 and Sentinel-2 observations were smoothed and interpolated and phenological parameters, such as the onsets of greenness and senescence were extracted after carefully examining various suitable techniques. These metrics were then closely evaluated and compared with variations in topography, climate, species composition and tree height using a Random Forest model in order to identify the drivers of phenology changes. The results showed high dependencies of start and end of season on elevation with forest stands over 1400 m experiencing an increasingly delayed reaction. The maximum value of vegetation greenness throughout the year was also positively correlated with the timing of phenological events. Furthermore, it was identified that growth started earlier on average in areas where the dominant species is Nothofagus dombeyi and later where Nothofagus antarctica dominates the forest. A possibly related finding could be made for tree height with taller trees experiencing an advanced start of season and vice versa. End-of-season events showed much fewer spatial differences. Temporally, no explicit trend was detected in the study period, but smaller connections to climate could be revealed for most years. It was also discovered that EVI serves as a much better indicator of plant productivity in the region than NDVI. The results prove that several phenological differences exist within the complex Araucaria forest ecosystem. These characteristics and their influence factors help to better understand the dynamics of untouched forest stands in the region, especially with regard to future challenges caused by climate change and can be a basis for local authorities in developing better forest management and conservation strategies within and outside of protected areas. As part of a joint project between TU Dresden and Universidad de Chile, this master’s thesis also delivers important contributions to ongoing research activities about the impact of human influence on the Araucaria forest ecosystem.
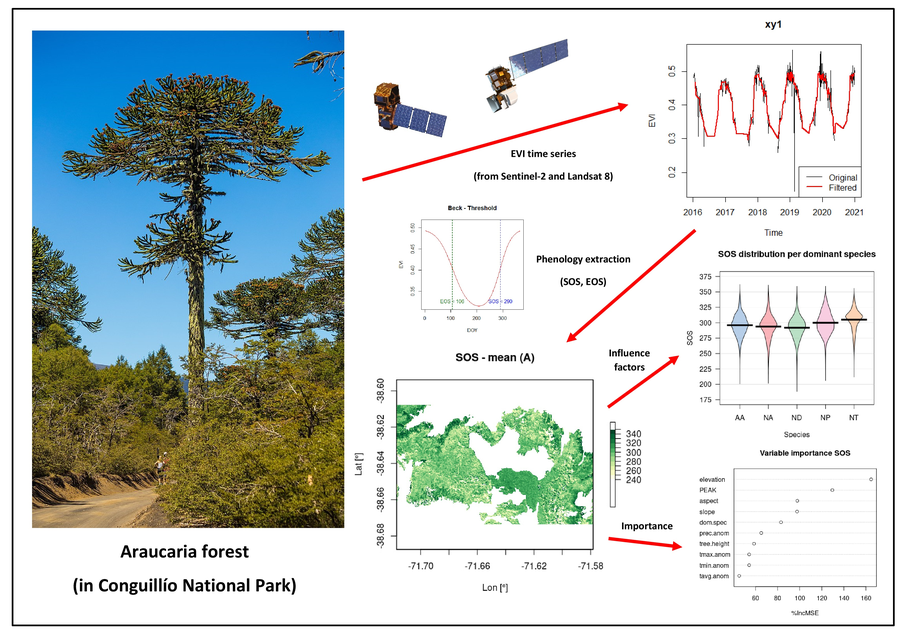
Graphical abstract
Capability of CNNs for analyzing land cover using historical CORONA data
Study
MSc Geography
Date of defence
15.10.2020
Supervisor
Matthias Forkel, Pierre Karrasch
Abstract
Land cover and the climate system are closely interlinked components. This interlinkage means that the decades-long change in land cover also plays a significant role in climate change. With the help of remote sensing and the civilian Landsat satellites, it has been possible to monitor land cover since 1972 continuously. There have also been earlier efforts to monitor the earth with satellites. The military satellite program CORONA was able to take single-channel images of the earth's surface from 1959 to1972. These images were not made available to the public until 1995. Until today they are a barely used data source for land cover change worldwide. This work aims to develop a Convolutional Neural Network (CNN), which can automatically extract land cover from CORONA images. The CNN was trained and evaluated based on the study areas Saxon Switzerland and Zittau Mountains. Germany in 1965. CNN is a method of machine learning, which is particularly suitable for the processing of image data. In remote sensing, CNNs have already been successfully used for object recognition and classification of multispectral data. So far, however, there are no detailed studies on the use of single-channel images for land cover classification.
For this study, three different input data were generated from the CORONA data: the first is the unchanged, original pixel values of the CORONA images; the second is calculated GLCM texture measures, which include the neighbouring pixels for calculation; the last are the original pixel values together with the landscape metrics of a previous segmentation. Based on these input data and existing information about the land cover of the study area in 1965, image sections for the individual land cover classes were extracted. The learning and training of CNN needed these image sections. In total, six different training options were investigated. The first finding from the training was the very low accuracy of the CNNs that trained on the landscape metrics. With an accuracy of less than 50%, they were far below the results of the other two input data of 85% to 90%. As a result, the landscape metrics were not considered for the rest of the study. The training accuracies were compared, and the best three with accuracies of 83% were applied to the two study areas. One model classified on the Original Pixel Values and the other two on the Texture Measures.
Using an iterating search window, the CNN models were deployed to the study areas. Classification accuracies between 69% and 75% were achieved for the study area Saxon Switzerland. The application to the study area Zittau Mountains did not achieve such high values. The Original Pixel Values attained an accuracy of 61% while the Texture Measures only yielded an accuracy of 1.8% and 3.5%. These results indicate an overtraining of the model since drastically reduced accuracies were achieved in the Zittau Mountains region. Reasons for this could be an unequal distribution of the training data for the individual land cover classes, differences between the two CORONA images, and homogeneity of the image values between the individual land cover classes. A concluding analysis of the land cover change between 1965 and 2012 showed an increase in urban and agricultural areas. The open-cast mining and the subsequent natural conversion characterises the Zittau Mountains area. The forested area has not changed significantly in the 47 years.
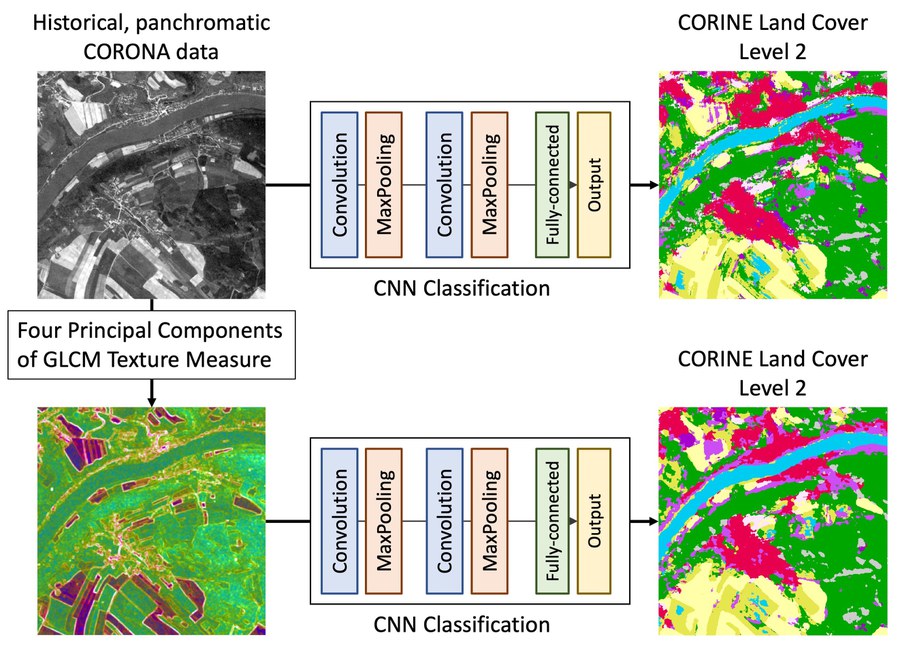
Graphical abstract
Potential of multi-temporal Sentinel-2 data to retrieve leaf live-fuel moisture content
Study
BSc Geodesy and Geoinformation
Date of defence
08.10.2020
Supervisor
Matthias Forkel, Luisa Schmidt
Abstract
The objectives of this thesis are the evaluation of already proven spectral indices, development of new approaches using the red-edge and the development of
multi-variate regression models in terms of Live Fuel Moisture Content (LFMC)
approximation. The data used in this thesis is multi-spectral bottom of the atmosphere Sentinel-2 data and LFMC in-situ data from the National Fuel Moisture Database (NFMD). The results of other studies regarding correlations between short wave infrared (SWIR) indices and LFMC cannot be confirmed. However the results of indices using bands of the red-edge or near red-edge bands are promising in that regard. In addition to this, when developing new models based on Sentinel-2 data for LFMC approximation, a new method is developed. For the purpose of model development, a new method is being developed that uses explorative factor analysis (EFA) to derive latent factors of strongly correlated
indices in order to solve the problem of multi-variant models with multicollinearity. In this context, a workflow for the development with this method is proposed. Furthermore, these derived latent factors are combined with other indices in multi-variate regression models. These are developed for the land cover types bushland and grassland and yield both similar results with R2 = 0.610 for shrubland and R2 = 0.666 for grassland. The developed models will also be tested individually on individual vegetation species and locations. These tests show the robustness of the developed latent factors and the developed LFMC models in comparison to the individual indices.
Developing Data Cylinders to map changes and feedbacks between Arctic Sea Ice and Vegetation
Study
MSc Cartography
Date of defence
28.09.2020
Supervisor
Matthias Forkel, Dr. Paulo Raposo (University of Twente)
Abstract
Arctic sea ice hits second-lowest level on record in 2020 and a “new Arctic” climate era is commencing (Landrum & Holland, 2020). Living on a planet which is facing a global climate change, the understanding and the communication of those vast environmental changes have great importance. The objective of this thesis is the development of a three-dimensional spatio-temporal visual, in a cylindrical shape due to the circularity of the Arctic region, depicting the analysis of the changes of the sea ice and vegetation in the Arctic. Level4 remote sensing data is used for the vegetation and sea ice concentration in a pan-arctic scale for the needs of this research. Its main outcomes are the changes themselves mirrored through their anomalies, and the creation of one cartographic product which illustrates these phenomena in the best suitable way.The representation of time and space in a single visual has been viewed as a challenge in the field of modern cartography for many decades. While data-cubes have been proposed for regional or even global geographical data visualisation, the polar regions seem not suitable for such cubes. The proposed cartographic representation of the Arctic space and time into “Data-Cylinders” responds to the challenging befitting of physical phenomena along space and time.The context of the “Data-Cylinders” includes the visualisation of the changes of climatic and physical phenomena in the form of time-series. A cylinder in this case could be described as many circular maps on top of the other in chronological order. “Space” in this scenario is placed across cycles, while “time” is given along the height of the cylinder.