Results
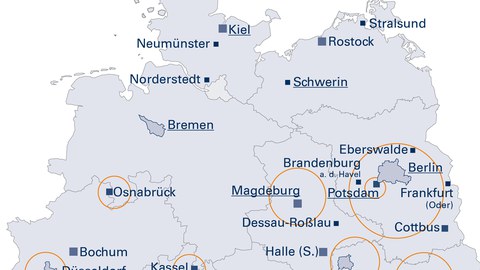
The Technical University of Dresden has completed the city-specific analysis of the data collected from the 11th iteration of the SrV time series.
The cross-city results and report of the 2018 survey, posted in November 2019, can be downloaded from this page simply by clicking "Learn More" or scrolling down.
Results of SrV 2018
Cross-city trends and key findings of the 2018 survey have been compiled in the following presentation:
SrV 2018 - Presentation of Results
The SrV Comparison of Cities measured and compared the key baseline parameters of traffic behavior with regard to the residential populations of the participating study areas.
SrV 2018 - Comparison of Cities
The tabulation of the cross-city results enabled a more differentiated evaluation of attribute combinations than in the standard city-specific tables. This made it possible to make statements that do not usually lead to statistically stable results for an individual city. Thus, even cities that did not participate in the SrV are still able to obtain orientation values for typical characteristics of travel behavior in their own municipality through mobility indices established for city groups.
The first approach focused primarily on the consideration of modelling aspects as a cross-sectional analysis of the current survey. Since the composition of the city groups varied depending on the participating municipalities, they were not suitable for time-series observations. Based on the central features, population size, and topography, seven city groups were formed:
-
Sub-/Basic-/Small Center/Rural Communities; Topography: flat
Data Overview Report - Sub-/Basic-/Small Center/Rural Communities; Topography: hilly
Data Overview Report - Mid-Sized Towns; Topography: flat
Data Overview Report - Mid-Sized Towns; Topography: hilly
Data Overview Report - Regional Centers under 500.000 inhabitants; Topography: flat
Data Overview Report - Regional Centers under 500,000 inhabitants; Topogrphy: hilly
Data Overview Report - Regional Centers of 500,000 or more inhabitants (excluding Berlin); Topography: flat
Data Overview Report
The second approach was mainly used for the presentation of cross-city results and is suitable for time-series observations. As seen previously in SrV 2013, the following three city groups were formed:
- SrV-Städtepegel
Data Overview Report - SrV-Wiederholerstädte West
Data Overview Report - Große SrV-Vergleichsstädte
Data Overview Report
The SrV 2018 Methodology Report provides a comprehensive description of the survey methods used in this project. The appendix contains the list of research questions. The report on non-response analysis and weighting supplements the Methodology Report with key details.


