C.elegans mitosis
The mitotic spindle is a three-dimensional dynamic microtubule-based apparatus that ensures the segregation of chromosomes during cell division. The dynamic properties of microtubules in spindles are modulated by many factors, including polymerases, depolymerases, motor proteins, cross-linkers and other microtubule associated proteins, of which many are conserved throughout eukaryotic organisms. Despite this evolutionary conservation of essential factors, there is a remarkable variability in spindle organization and mechanics between organisms and tissues within species. The mechanisms of adjusting spindle size, shape and mechanics are barely understood by today.
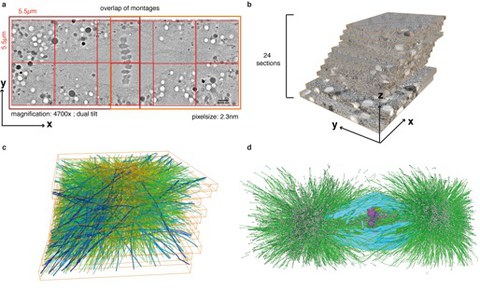
I am combining large-scale serial electron tomography of whole mitotic spindles in early C. elegans embryos with live-cell imaging to uncover the organization of microtubules in the spindle (Figure 1). Dynamic and ultra structural data can then be used to develop and test models of spindle assembly and chromosome segregation.
Using tomography we reconstructed the positions of all microtubules in several mitotic spindles in metaphase and anaphase in one cell C. elegans embryos in 3D (Figure 2). These reconstructions enabled us to classify the microtubules as kinetochore, spindle, or astral microtubules according to their positions, and to quantify distinct properties of each class. Despite a centrosomal orginin of microtubules composing the spindle, we find only a few kinetochore microtubules directly connected to the centrosomes. By quantitatively analysing several models of microtubule growth, we conclude that minus-ends of kinetochore microtubules have selectively detached and depolymerized from the centrosome. Our results show that the connection between centrosomes and chromosomes is mediated by the entire spindle network and that any direct connections through kinetochore microtubules are few and likely very transient.

Figure 1: Workflow of large-scale tomography 3D reconstructions.
Figure 1: Workflow of large-scale tomography 3D reconstructions
a, Two 2 x 3 montages (outlined in dark red, individual tomograms composing the montages are outlined in light red) are acquired and joined in X and Y to cover the entire area of the spindle. The size of a single tomogram, the magnification, and voxelsize are indicated. The thickness of a section is 300 nm b, Approximately 25 consecutive sections have to be acquired to cover the spindle volume. c, Microtubules (green) are automatically traced and manually corrected using the AMIRA software. This software is also used to stitch the individual sections in z. d, Features like chromosomes (purple) or the nuclear envelope (light blue) are segmented manually.

Figure 2. 3D reconstruction of spindle and kinetochore microtubules
Figure 2. 3D reconstruction of spindle and kinetochore microtubules
a, Model of microtubules and chromosomes of a full metaphase spindle. b, Model of a half spindle in metaphase. c-d, Models of half spindles in anaphase. e-h, Corresponding 3D models of KMTs in metaphase and anaphase of the reconstructions as shown in a-d. The number of microtubules for each reconstruction is indicated. Scale bar 1 µm.
Movie 1. Illustrative visualization of the reconstruction of a complete metaphase spindle dataset in C. elegans © Redemann et al. (2017)
Movie 1. Illustrative visualization of the reconstruction of a complete metaphase spindle dataset in C. elegans
The kinetochore microtubules are depicted in red, astral and spindle microtubules in green. A segmentation of the chromosomes is shown in blue.
