Correlation of centrosome size and spindle architecture in early C. elegans embryos
Centrosomes are the main microtubule organizing centers (MTOCs) in most animal cells and are involved in setting up the mitotic bipolar spindle. They consist of a pair of centrioles surrounded by an electron-dense matrix called pericentriolar material (PCM). Recent studies have shown that centrosome size sets mitotic spindle length in the early C. elegans embryo and that the centrosome volume correlates with cell size due to limiting amounts of cytoplasmic components incorporated into the PCM [1,2].
Our aim is to understand the mechanism of spindle architecture adapting to changes in centrosome size on an ultrastructural level and how this scaling relates to the length and density of spindle microtubules.
Using the early C. elegans embryo as a model system, we depleted centrosomal proteins by RNAi to generate centrosomes of different sizes within a single embryo. Currently, our work is focused on SAS-4, required for centriole duplication. Partial depletion of SAS-4 results in structurally defective centrioles, which recruit less PCM and therefore show asymmetric spindles in the second mitotic division with centrosomes of varying sizes [3]. Although light microscopic data suggest a correlation between centrosome size and the number of nucleated microtubules, ultrastructural evidence for this hypothesis is missing. Therefore, we apply a correlative light and electron microscopy (CLEM) approach by combining live-cell imaging and 3D- electron tomography of high-pressure frozen specimens [4]. We present the first 3D- reconstruction of highly asymmetric P1 spindles and found that reducing the PCM volume leads to a dramatic decrease in half spindle length compared to wild type. Additionally, our data shows a reduction of microtubule number in small spindle poles by a factor of 10.
Our long-term goal is to visualize the ultrastructural organization of mitotic spindles of different sizes to develop a model characterizing the functional link between centrosome size and spindle architecture.
[1] Decker et al. 2001. Curr. Biol. 21, 1259-1267.
[2] Greenan et al. 2010. Curr. Biol.. 20, 353-358.
[3] Kirkham et al. 2003. Cell. 112, 575-587.
[4] Muller-Reichert et al. 2003. J. Microsc. 212:71-80.

Figure 1: Live-cell imaging of sas-4 (RNAi) C. elegans two-cell embryos.
Figure 1: Live-cell imaging of sas-4 (RNAi) C. elegans two-cell embryos.
Sum projection of confocal stacks using SPD-2::GFP to visualize centrosomes (green) and H2B::mCherry to mark chromosomes (red). The anterior side of embryos is orientated to the left. Scale bar = 10 µm. A: Wild type embryos exhibit equally sized centrosomes and perfectly manage mitotic divisions. B: Full depletion of sas-4 by RNAi injection (24h) causes monopolar spindles in two-cell embryos uncapable of proper chromosome segregation in subsequent mitotic divisions. C: Partial depletion of sas-4 by RNAi feeding (24h) leads to an intermediate phenotype showing highly asymmetric spindles within the P1 cell resulting in a small (arrow) and a normal sized centrosome.
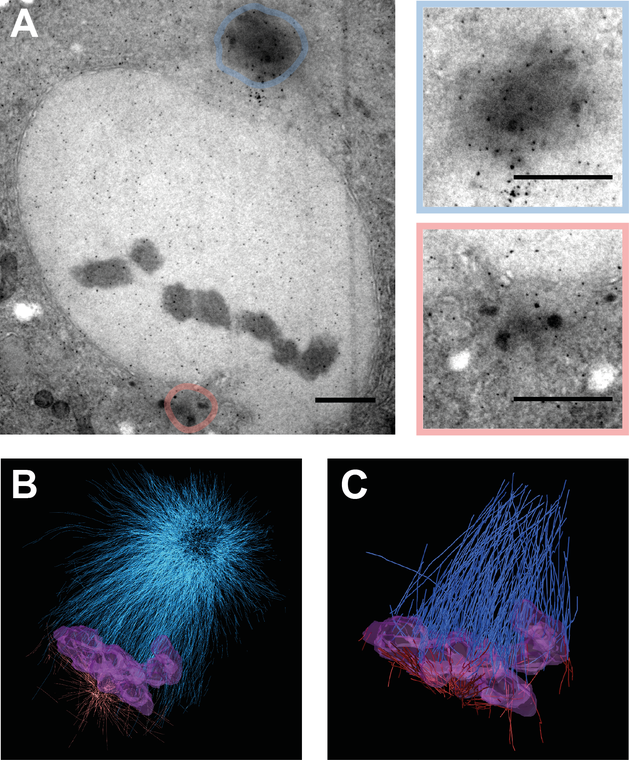
Figure 2: Electron Tomography of sas-4 (RNAi) two-cell embryos.
Figure 2: Electron Tomography of sas-4 (RNAi) two-cell embryos.
TEM images of high pressure frozen and sectioned C. elegans two-cell embryos at metaphase obtaining an asymmetric spindle in P1 cell. A: Asymmetrical P1 spindle at metaphase revealing a large centrosome in blue and a small centrosome in red. Color coded magnifications of centrosomes depicted on the right. Scale bar = 1 µm. B: 3D reconstructed volume of spindle shown in A. Blue: Microtubules of large pole, Red: Microtubules of small pole, Violet: chromosomes C: Filtered kinetochore microtubules from 3D reconstruction shown in B.