Camera Test Instructions
- Terms and definitions
- Use of the test pictures
- Test picture 1: "Resolution, determination of borders and grey scales"
- Test picture 2: "Color fidelity, color gradients, grey scale values"
Terms and definitions
For detailed explanation, basic terms are defined below.
- Aliasing
Errors which occur because of disregarding the sampling theorem (sample frequency too low) at the digital sampling of signals are called aliasing in the field of signal analysis. In image processing and computer graphics, aliasing occurs at sampling images and causes patterns which are not included in the original picture (e.g. Moiré patterns).
In signal processing, aliasing occurs at digitalising analog signals. To restore the original signal correctly, only frequency components smaller than the Nyquist frequency (half the sample frequency) may appear in the sampled signal. If this sampling theorem is violated, frequency components higher than the Nyquist frequency are interpreted as lower frequencies. The higher frequencies sort of pass off as lower, which explains the term alias.
In image processing and computer graphics, aliasing occurs at sampling images. The stair effect, which occurs at rasterization of geometric figures, is often called aliasing, although this is no "real" aliasing in terms of signal analysis.To avoid such effects, the incoming signal is filtered by a low-pass (anti aliasing filter), to soften the high frequency components which are responsible for the alisaing. (source: Wikipedia) - Horizontal resolution
The resolution value, which is measured at the longer side of the picture according to the horizontal picture alignment "Landscape". Typically this happens by using vertically aligned test patterns. - Image aspect ratio
Ratio of picture width and height. Typical aspect ratios are 16:9, 3:2, 4:3, 1:1. - Image compression
Process of data reassignment and re-encoding of a digital image with the aim to reduce the size of the image data. - Pairs of lines per millimeter lp/mm
Metric to specify the resolution in terms of the number of equally wide black-white pairs of lines per millimeter, which can still be resolved. - Lines per millimeter lines/mm
Metric to specify the resolution in terms of the number of equally wide black and white lines per millimeter, which can still be resolved. - Line widths per picture height LW/PH
Metric to specify the thickness of a continuous test pattern line relatively to the height of the active region in the test picture. This is equivalent to to the quotient out of height of the active region in the test picture and thickness of the black line. It results in the total number of displayable lines of this thickness, which can be strung together in the existing pattern with the height of the test picture or the camera's vertical field of view. Example: If the height of the active region of the test picture is 20 cm, then one black line equates to the metric 1000LW/PH 20/1000cm. - Resolution
Measure of the possibility of a camera system or a camera system component to display picture details. - Test Chart
Alignment of different test patterns which were created to check certain aspects of an imaging system. - Test Pattern
Specified alignment of certain test characteristics which can be used to check quality characteristics of the picture.
Here, bi-tonal patterns, grey scale patterns and spectral patterns are distinguished.- Bi-tonal patterns are neutral in terms of color and solely consist of two differnet color values (mostly black and white).
- Grey scale patterns are neutral in terms of color and consist of a large number of grey scale values in a strongly specified arrangement. Typically they are used for measuring opto-electronic conversion functions.
- Spectral patterns consist of elements of different coloring in a strongly specified arrangement, which are typically used for checking a correct color reproduction.
- Vertical resolution
The resolution value, which is measured at the shorter side of the picture according to the vertical picture alignment. Typically this happens by using horizontally aligned test patterns. - Visual resolution
Spacial frequency, from which on the individual black and white lines of a test pattern can not be distinguished in the recording any more by the observer or due to aliasing are displayed with a spacial frequency which is lower than the spacial frequency of the corresponding test patterns section.
Use of the test pictures
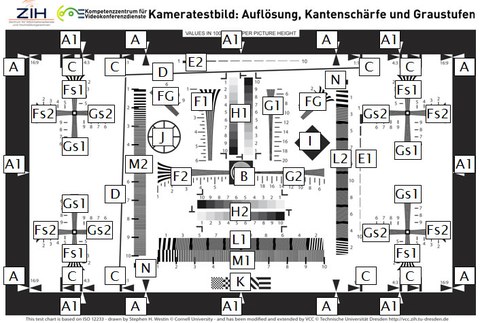
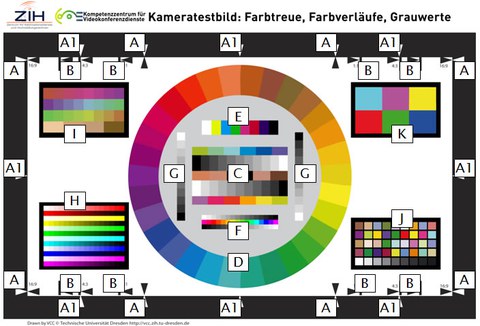
There are two different test pictures applied which are marked by unique test patterns. Test picture "Resolution, determination of borders and grey scales" conduces to the examination of all parameters relevant for resolution and representation and contains different bi-tonal test patterns which are neutral in terms of color as well as grey scale patterns, which are explained in detail here. Test picture "Color fidelity, color gradients, grey scale values" contains test patterns of different spectral fields as well as different developings of grey scale values, which are described in detail here.
The active height of the test images should not be less than 20 cm, the printing material should be reflective on front lighting and should be illuminated evenly.
Tested camera should be positioned firmly. The vertical clipping arrows are used to adjust the magnification and to chose the according section of the test picture, depending on the picture format. The horizontal clipping arrows conduce to the horizontal centering of the target. The arrowheads of the black clipping arrows should be completely visible, the white clipping arrows should not be visible anymore. The camera should be positioned in a way that the horizontal clipping of the test picture is parallel to the horizontal camera frame line and the picture layer parallel to the camera layer. On using the test picture "Color fidelity, color gradients, grey scale values", the fact that all spectral test patterns are visible in the camera image must be observed.
The visual resolution (in LW/PH) is the limit below which individual black and white lines can still be distinguished in the test patterns or are displayed with a lower frequency due to aliasing. For this purpose, test picture 1 (camera test picture "Resolution, determination of borders and grey scales") integrates vertical, horizontal and diagonal hyperbolic curves F1, F2, G1, G2, Fs1, Fs2, Gs1, Gs2, FG. The central horizontal visual resolution is determined by observing the vertically aligned hyperbolic curves F1 and G1, the central vertical resolution by the horizontally aligned hyperbolic curves F2 and G2. The 45° diagonal visual resolution is determined by the diagonally aligned test patterns FG. The visual resolution in the border area of the camera can be determined by using the test patterns Fs1, Fs2, Gs1 and Gs2.
To determine the visual resolution, the test picture (either printed in high quality or displayed on a monitor of according size and resolution) has to be positioned and adjusted as described above, to read off the corresponding values by subjective measuring.
Camera test picture "Resolution, determination of borders and grey scales"
| Element | Meaning |
|---|---|
| A | Black frame with black and white arrow markers for horizontal adjustment on 16:9 image format |
| A1 | Black and white arrow markers as assistance for camera adjustment |
| B | Central dual frequency illustration an black frame, conduces to focussing |
| C | Frame lines and boundary arrows for camera image formats 1:1, 4:3, 3:2 |
| D | Inclined lines for checking the linearity of the raster and stair stepping |
| E1 | 100LW/PH up to 1000LW/PH black bars for measuring the horizontal pulse respond |
| E2 | 100LW/PH up to 1000LW/PH black bars for measuring the vertical pulse respond |
| F1 | 100LW/PH up to 600LW/PH hyperbolic line display for measuring the central horizontal visual resolution |
| F2 | 100LW/PH bis 600LW/PH hyperbolic line display for measuring the central vertical visual resolution |
| Fs1 | 100LW/PH bis 600LW/PH hyperbolic line display for measuring the peripheral horizontal visual resolution |
| Fs2 | 100LW/PH bis 600LW/PH hyperbolic line display for measuring the peripheral vertical visual resolution |
| FG | 100LW/PH bis 1000LW/PH hyperbolic line display for measuring the inclined visual resolution |
| G1 | 500LW/PH bis 2000LW/PH hyperbolic line display for measuring the central horizontal visual resolution |
| G2 | 500LW/PH bis 2000LW/PH hyperbolic line display for measuring the central vertical visual resolution |
| Gs1 | 500LW/PH bis 1000LW/PH hyperbolic line display for measuring the peripheral horizontal visual resolution |
| Gs2 | 500LW/PH bis 1000LW/PH hyperbolic line display for measuring the peripheral vertical visual resolution |
| H1 | vertical grey scale gradients of 10 grey scales for checking the differentiability of the grey scales |
| H2 | horizontal grey scale gradients of 10 grey scales for checking the differentiability of the grey scales |
| I | diagonal black square for checking the correct aspect-ratio, stair stepping by rasterization and for calculation of SFR |
| J | circle with crossed lines for checking of non-linearity on sampling (e.g. wrong aspect-ratio) |
| K | checkerboard pattern to check for compression artefacts |
| L1 | inclined (about 5°) square wave sequence for checking the horizontal aliasing ratio |
| L2 | inclined (about 5°) square wave sequence for checking the vertical aliasing ratio |
| M1 | 100 up to 1000 lines square wave for checking the horizontal visual resolution |
| M2 | 100 up to 1000 lines square wave for checking the horizontal visual resolution |
| N | markers, which can be used for automatic adjustment |
Camera test picture "Color fidelity, color gradients, grey scale values“
| Element | Meaning |
|---|---|
| A | Black frame with black and white arrow markers for horizontal adjustment on 16:9 image format |
| A1 | Black and white arrow markers as assistance for camera adjustment |
| B | Frame lines and boundary arrows for camera image formats 1:1, 4:3, 3:2 |
| C | TE256: Color and Calibration Test Chart: 11-stepped grey radient, black/white pattern, 12 colors, 4 skin color tones |
| D | TE229: color Key Test Chart: color circle with 30 elementary colors |
| E | TE106: Color Bar Test Chart: 8 fields (black, white + primary colors) |
| F | 16-stepped grey gradient horizontal in two directions including 16-stepped color patch gradient |
| G | 11-sepped grey gradient vertical in two directions |
| H | elementary colors CMYK/RGB black gradient and white gradient in 16 steps |
| I | TE233: 24 little saturated colors and 4 skin color tones |
| J | TE226: HDTV Color Rendition Test Chart (according to Gretag Macbeth) |
| K | TE209: Cine Color Test Chart |


