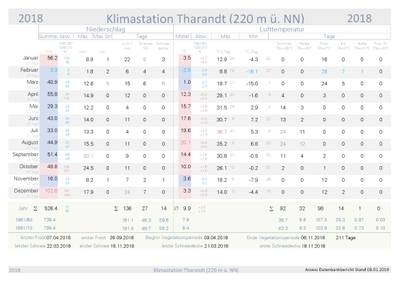
Tharandt climate station

Location:
220 m above sea level, 50°59' N, 13°35' E, in a notch valley
to the current measurement data
Chronicle:
| 1868 | First climate measurements in Tharandt |
| 1951- 8/2002 | Measuring field near Pienner Str. 9 (agricultural meteorological station) |
| 8/2002 | Measuring field destroyed by flooding |
| from 9/2002 | Provisional measurements at the Judeich building |
| from 13.06.2003 | First measurements from the new measuring field in Tharandt |
| 2007 | Commissioning of the measuring platform on the roof of the building |
Measurements and observations:
- Air temperature, relative humidity
- Ground temperatures
- Wind speed and direction
- Global radiation, sunshine duration, diffuse sky radiation
- Soil moisture
- Precipitation (various systems), type and intensity of precipitation
- Snow depth
- evaporation
- Various special measurements
Annual report 2019

The last months at a glance:
(Deviation61. = Deviation from the long-term data 1961-1990,
Deviation81. =deviation from the long-term data 1981-2010) :
| Month | TMitt | Deviation61. | Dev81. | TMax | TMin | Low. | Abw61. | Down81. |
|---|---|---|---|---|---|---|---|---|
| °C | K | K | °C | °C | mm | % | % | |
| 11/2020 | 4.6 | +0.8 | +0.9 | 20.2 | -5.2 | 10.1 | 18 | 15 |
| 10/2020 | 9.8 | +1.4 | +1.3 | 22.8 | 0.0 | 119.9 | 245 | 242 |
| 09/2020 | 14.0 | +1.2 | +1.0 | 30.5 | 1.5 | 70.9 | 119 | 123 |
| 08/2020 | 19.7 | +3.6 | +2.6 | 35.0 | 8.1 | 88.0 | 107 | 91 |
| 07/2020 | 18.0 | +1.1 | +0.3 | 30.0 | 6.2 | 25.6 | 37 | 28 |
| 06/2020 | 17.0 | +1.6 | +1.3 | 31.9 | 6.1 | 54.2 | 69 | 81 |
| 05/2020 | 11.0 | -1.1 | -1.9 | 23.8 | -1.0 | 67.1 | 99 | 96 |
| 04/2020 | 9.3 | +2.2 | +1.3 | 24.5 | -6.2 | 3.8 | 6 | 8 |
| 03/2020 | 4.2 | +1.1 | +0.5 | 19.1 | -7.5 | 32.4 | 62 | 51 |
| 02/2020 | 4.9 | +5.1 | +4.7 | 15.5 | -3.0 | 126.0 | 273 | 232 |
| 01/2020 | 2.2 | +3.4 | +2.7 | 13.3 | -7.0 | 23.2 | 45 | 39 |
| 12/2019 | 2.7 | +2.3 | +2.3 | 12.2 | -6.4 | 38.2 | 60 | 55 |
| 11/2019 | 4.8 | +1.0 | +1.1 | 16.6 | -5.4 | 26.7 | 47 | 39 |
further months back to 2005 can be found here >
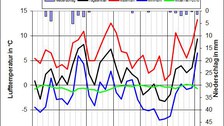
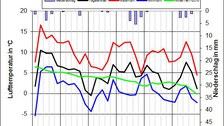
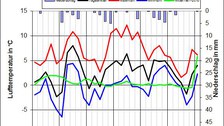
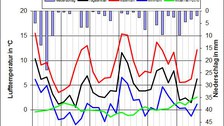
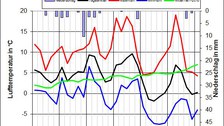
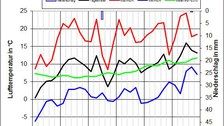
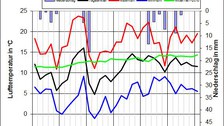
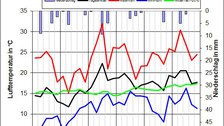
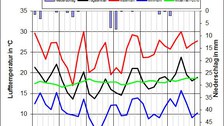
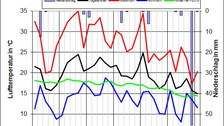
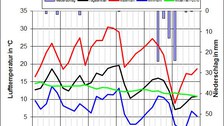
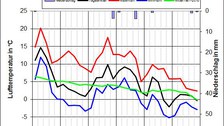
Monthly charts of the last 13 months

© Meteorologie

© Meteorologie

© Meteorologie

© Meteorologie

© Meteorologie

© Meteorologie

© Meteorologie

© Meteorologie

© Meteorologie

© Meteorologie

© Meteorologie

© Meteorologie
Trends in the number of days and entry days


© Meteorologie


© Meteorologie


© Meteorologie


© Meteorologie


© Meteorologie


© Meteorologie


© Meteorologie


© Meteorologie


© Uwe Eichelmann


© Uwe Eichelmann
Special features of the last few months:
| November 2020 | Maximum air temperature above 20 °C for the first time in the measurement series since 1952 |
| February 2020 | After 1990, the warmest February since the start of the measurement series, 1990 +4.8 K, 2020 +4.7 K compared to the 1981-2000 series; highest precipitation total since 1946 (with 157 mm) at 126 mm |
| June 2019 | Warmest June (20.1 °C) since measurements began in 1868 |
| January 2019 | unusually high precipitation totals for January within a short period of time (64 mm in 3 days) |
| 2018 and 2019 | Year with the most summer days to date (92) |
| 2015 |
Only 2 days with TMax<0 °C(ice days) |
|
December 2015 |
warmest December since observations began |
| November 2015 |
The first two decades together were the warmest since observations began |
|
Jun - Sep 2015 |
Most"hot days" since observations began (27 days >= 30 °C) |
|
August 2015 |
warmest August since measurements began (20.5 °C) |
|
May 2013 |
last decade of May highest rainfall since observations began |
|
March 2013 |
For the first time since observations began in 1952, 30 days with frost (mean 16.9 days) and 31 days with snow cover (mean 7.8 days). The second and third decades were the coldest since 1952 |
| October 2012 | On the 28th, the largest closed snow cover of 13 cm measured to date since observations began in 1952. |
| August 2012 | A new temperature record of 38.4 °C was set on the 20th (measurements since 1952). The previous record was 37.0 °C on 7 July 1957. |
| February 2012 | first decade second coldest since 1952. |
| November 2011 | driest November since measurements began in 1868 |
| July 2011 | Precipitation total 211 mm corresponds to 308 % of the normal value |
| December 2010 | Precipitation total 143.9 mm corresponds to 226 % of the normal value Snow depth of 56 cm on the 28th is the greatest height ever measured in December (measurements since 1952) Monthly average air temperature -4.9 °C and thus a deviation of -5.3 K from the normal value |
| November 2010 | Precipitation total 133.3 mm corresponds to 233 % of the normal value Snow depth of 23 cm on the 30th is the greatest height ever measured in November (measurements since 1952) |
| October 2010 | Precipitation total 9.2 mm corresponds to only 19 % of the normal value |
| September 2010 | Precipitation total 130.6 mm corresponds to 218 % of the normal value |
| August 2010 | Precipitation total 204.6 mm corresponds to 249 % of the normal value |
| January 2010 | Deviation from normal value -3.5 K, 22 ice days (annual average 21.3 ice days) |
Climate (30-year series):
| 1961-1990 | 1981-2010 | 1961-1990 | 1981-2010 | |
| Temperature in °C | Temperature in °C | Precipitation in mm | Precipitation in mm | |
| January | -1.2 | -0.5 | 52.0 | 59.5 |
| February | -0.2 | 0.2 | 46.2 | 54.2 |
| March | 3.1 | 3.7 | 52.0 | 63.6 |
| April | 7.1 | 8.0 | 61.4 | 49.8 |
| May | 12.1 | 12.9 | 67.6 | 69.9 |
| June | 15.4 | 15.7 | 79.0 | 66.5 |
| July | 16.9 | 17.7 | 68.5 | 91.4 |
| August | 16.1 | 17.1 | 82.2 | 96.2 |
| September | 12.8 | 13.0 | 59.8 | 57.8 |
| October | 8.4 | 8.5 | 48.9 | 49.4 |
| November | 3.8 | 3.7 | 57.2 | 67.6 |
| December | 0.4 | 0.4 | 63.8 | 69.5 |
| Year | 7.8 | 8.4 | 738.4 | 795.4 |
Number of days and last years:
| 1981-2010 | 2014 | 2015 | 2016 | 2017 | 2018 | 2019 | 2020 | |
| Summer days (Tmax>=25 °C) | 43.3 | 40 | 53 | 58 | 52 | 92 | 65 | 59 |
| Hot day (TMax>=30 °C) | 8.3 | 6 | 27 | 8 | 11 | 32 | 26 | 15 |
| Frost days (TMin<0 °C) | 102.9 | 93 | 97 | 99 | 93 | 98 | 91 | |
| Ice days (TMax <0 °C) | 22.2 | 11 | 2 | 10 | 12 | 14 | 3 | |
| Days with snowfall (snow, sleet, >=0.1 mm) | 49.7 | 16 | 43 | 44 | 39 | 27 | 28 | |
| Days with snow cover >= 1 cm | 58.2 | 21 | 21 | 36 | 54 | 14 | 40 | |
| Cold days (TMax<=-10 °C) | 0.7 | 0 | 0 | 0 | 0 | 1 | 0 | 0 |
| Tropical nights (TMin>=20 °C) | 0.1 | 0 | 1 | 0 | 0 | 0 | 0 | 0 |
absolute records:
- lowest minimum air temperature: -29.0 °C (11.02.1956)
- Highest minimum air temperature: 20.4 °C (12.07.1984)
- Highest maximum air temperature: 38.4 °C (20.08.2012)
- coldest day: -23.9 °C (09.02.1956)
- highest daily total of precipitation: 217 mm (12.08.2002, interpolated)
- lowest minimum air temperature 5 cm above the ground (since 1984): -31.8 °C (06.01.2009)
- Highest monthly average air temperature: July 2006, 21.2 °C
- lowest monthly average air temperature: February 1956, -11.9 °C
- lowest monthly precipitation total: April 2007, 0.0 mm
- highest monthly precipitation total: August 2002, 350.6 mm
average number per year:
- Hot days (TMax >=30 °C, 1952-2019, excluding 2002): 8.1
- Summer days (TMax>=25 °C, 1952-2019, without 2002): 40.6
- Frost days (TMin<0 °C, 1952-2019): 106.3
- Ice days (TMax<0 °C, 1952-2019): 22.6
- Days with snow cover (1954-2019 without 1967/74/75): 57.2
- Days with snowfall (1952-2019): 45.2
Periods:
- longest period with closed snow cover 25.11.1969 - 22.03.1970 (118 days)
average days of occurrence (1952 - 2018):
- first day with frost: October 15
- last day with frost: April 30
- Start of the growing season: March 29
- End of the growing season: October 17
- First snowfall: November 13
- last snowfall: April 17
- First snow cover: November 27
- last snow cover: March 24