Jan 25, 2017
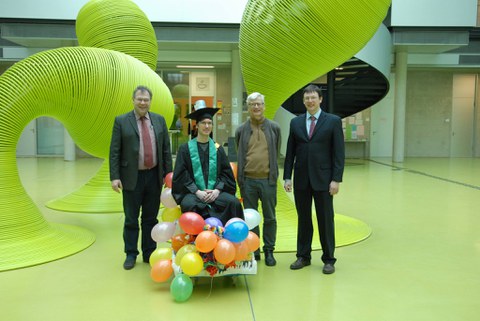
Jan Polowinski hat am 25.01.2017 seine Doktorarbeit erfolgreich verteidigt!
Ontology-Driven, Guided Visualisation Supporting Explicit and Composable Mappings
Data masses on the World Wide Web can hardly be managed by humans or machines. One option is the formal description and linking of data sources using Semantic Web and Linked Data technologies. Ontologies written in standardised languages foster the sharing and linking of data as they provide a means to formally define concepts and relations between these concepts. A second option is visualisation. The visual representation allows humans to perceive information more directly, using the highly developed visual sense. Relatively few efforts have been made on combining both options, although the formality and rich semantics of ontological data make it an ideal candidate for visualisation. Advanced visualisation design systems support the visualisation of tabular, typically statistical data. However, visualisations of ontological data still have to be created manually, since automated solutions are often limited to generic lists or node-link diagrams. Also, the semantics of ontological data are not exploited for guiding users through visualisation tasks. Finally, once a good visualisation setting has been created, it cannot easily be reused and shared. Trying to tackle these problems, we had to answer how to define composable and shareable mappings from ontological data to visual means and how to guide the visual mapping of ontological data.
We present an approach that allows for the guided visualisation of ontological data, the creation of effective graphics and the reuse of visualisation settings. Instead of generic graphics, we aim at tailor-made graphics, produced using the whole palette of visual means in a flexible, bottom-up approach. It not only allows for visualising ontologies, but uses ontologies to guide users when visualising data and to drive the visualisation process at various places: First, as a rich source of information on data characteristics, second, as a means to formally describe the vocabulary for building abstract graphics, and third, as a knowledge base of facts on visualisation. This is why we call our approach ontology-driven. We suggest generating an Abstract Visual Model (AVM) to represent and "synthesise" a graphic following a role-based approach, inspired by the one used by J. v. Engelhardt for the analysis of graphics. It consists of graphic objects and relations formalised in the Visualisation Ontology (VISO). A mappings model, based on the declarative RDFS/OWL Visualisation Language (RVL), determines a set of transformations from the domain data to the AVM. RVL allows for composable visual mappings that can be shared and reused across platforms. To guide the user, we discourage the construction of mappings that are "non-optimal" according to rankings formalised in the fact base and suggest, e. g., more effective mappings instead. The guidance process is flexible, since it is based on exchangeable rules. VISO, RVL and the AVM are additional contributions of this thesis. Further, we initially analysed the state of the art in visualisation and RDF-presentation comparing 10 approaches by 29 criteria. Our approach is unique because it combines ontology-driven guidance with composable visual mappings. Finally, we compare three prototypes covering the essential parts of our approach to show its feasibility. We show how the mapping process can be supported by tools displaying warning messages for non-optimal visual mappings, e.g., by considering relation characteristics such as "symmetry". In a constructive evaluation, we challenge both the RVL language and the latest prototype trying to regenerate sketches of graphics we created manually during analysis. We demonstrate how graphics can be varied and complex mappings can be composed from simple ones. Two thirds/half of the sketches can be almost completely or completely specified/implemented.

