May 10, 2024
Workshop on data visualization with Prof. Kerschke
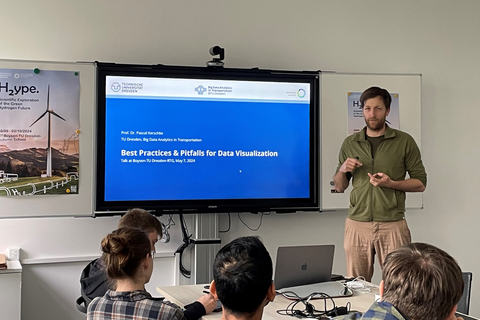
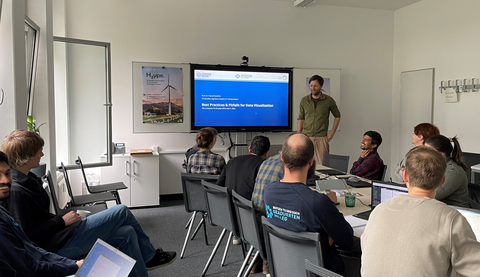
On Tuesday, 7 May 2024, Prof. Pascal Kerschke (Chair of Big Data Analytics in Transportation (TT) and supervisor of the E5 project) conducted a workshop on "Best Practices & Pitfalls for Data Visualization" with the Boysen-TUD- Research Training Group. He gave a lot of valuable advice on how to visualize data, what pitfalls there are when visualizing data and how to avoid them. At the same time, there was an open and lively discussion between the professor and the doctoral students.
The workshop covered the different ways to effectively represent data and emphasized the importance of choosing the correct visualization tools to represent data and relationships. From measures of location such as mean, median and variance, to complex heat maps and geographical maps, Prof. Kerschke demonstrated a wide range of tools, including visualization tools such as line charts, parallel coordinate charts, and strip charts. He described how each chart offers unique applications for different types of data.

Prof. Kerschke explains what to pay particular attention to when visualising data.
The second part of the workshop, "Pitfalls of Data Visualization", dealt with common mistakes that can lead to misinterpretation. It is crucial to focus on plausible relationships, avoid misleading representations and do not truncate the axes of coordinate systems, as misleading representations and truncated axes can distort the data representation. It is extremely important to present the data truthfully, even if it is unbalanced. Clear and realistic charts that realistically reflect the underlying data are essential.
Another important issue is to keep the visualization data not only complete but also clear. Important factors that researchers need to consider in their work include
- Avoidance of screenshots (images are not of high quality);
- legibility of all visualization elements (dots, texts, labels, and titles);
- Effective use of colors to draw attention to important figures;
- Ensuring that resulting values remain within the feasible range when error bars are used;
- Consider using text or tables when comparing a parameter across multiple categories;
- Using visual representations instead of long tables when working with complex data.
The 4th Boysen-TUD- Research Training Group would like to thank Prof. Kerschke for his time and valuable input. The workshop and what was learned in the process offer the doctoral students the opportunity to effectively present their own research results and thus provide qualitative, scientifically sound information for the (specialist) audience.

