Research Areas
Geovisualisation of user-generated, geospatial data:
In recent years, Volunteered Geographic Information (VGI) has become a new form of user-generated content, which includes both the active collection of geodata, for example in the context of "Citizen Science" projects, and its passive generation by mobile devices with a localisation function. In addition, more and more sensors are available, which enable the observation of the environment with ever greater levels of detail and high update rates. The interpretation and visualisation of this information represents a major challenge due to the strong heterogeneity of the underlying data and the necessary consideration of social context factors. The visualisation of spatial user-generated data is of great importance for analysis purposes, because there is little known about the influencing factors and their interrealtionships. In particular, large amounts of data can be accessed through a sensible combination of automatic statistical methods and interactive visual control. Since user-generated data is often available in the form of irregular data streams, real-time visualisation and dynamic representations are playing an increasingly important role in geovisualisation.
web- and mobile Cartography:
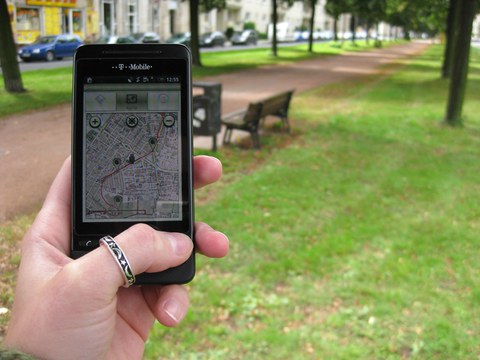
The use of maps with digital media in the form of web- and mobile maps involves several differences to classical cartography. The main difference is the interaction with the map, which is influenced by the terminal device, as well zoom capability and abstraction as a consequence thereof. To various extents web- and mobile maps are adaptable, i.e. customizable by the user, or adaptive, i.e. adapting themselves. For such an adaption, different context factors can be considered, like the current position of the user, day/night, social context (e.g. is the user a local or a tourist), user preferences etc. Sensors, especially sensors of mobile devices, help to realize context modelling. Furthermore web- and mobile maps enable a hybrid map use by linking the map with text, images, audio, video; as well as the presentation of real-time-data, e.g. the current position of means of transportation. Additionally mobile devices allow a computer-generated supplement of the real-world environment, called augmented reality, by overlaying virtual objects.
Automatic Generalisation:
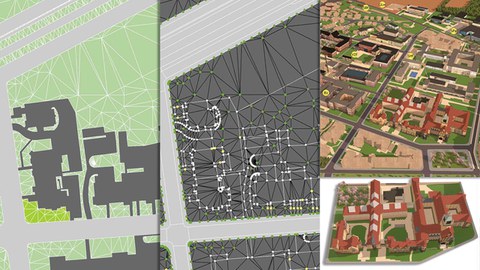
The production of topographical and thematic maps in analogue and digital form is increasingly being realised through automatic procedures and using web-based processing and generalisation services. Depending on the application and quality requirements, these are supported by manual, interactive pre- and post-processing. Current research work is therefore aimed at further developing automatic generalisation processes, in particular approaches for processing grouped cartographic objects. This requires, among other things, a consideration of structural, semantic and topological relationships. Further research focuses on demand-adapted generalisation (on-demand) and generalisation in real time (on-the-fly).
Environmental Monitoring:
Environmental Monitoring implies an observation of a geographic space in task-specific dimensions, scales and with a suitable set of sensors. A demand for contiguous monitoring of a space can often only be satisfied by the use of remote sensing data. Frequently, the observed phenomena become only transparent and explicable in a combination to other geo-data, whereas Geo-information Systems are the logical choice of a tool. Qualified visualisation techniques are crucial in finding of hypotheses, in the process description, the evaluation and documentation and dissemination of research results. Dynamic models may be complemented by dynamic visualisation techniques as, for instance, animations. Examples of the Institute’s activities can be found in the Ecological GIS of the Altai, in the flood documentation of the town of Dresden in 2002 and 2013, or in the research projects dealing with the dynamics of the cryosphere in high mountain landscapes.
3D-Visualisation:
Information on landscapes and their constituents is increasingly conveyed in three dimensions and in a dynamic and interactive way. Nowadays, many mobile, digital devices allow a display of rendered 3D models. Dynamics may relate to changes within the model or of the complete model, or result from a moving observer of a static situation, or may even combine a dynamic model state with dynamic observation. Virtual cameras may register their field of view in a stereoscopic mode. Thus, they can be source to stereoscopic 3D displays. Applications of digital 3D models are manifold. Be it the assessment of new developments, the explanation of natural processes, marketing of touristic sites, or any type of interest taken into tangible cultural heritage. The role of digital 3D models can be much more than just transport of visual impressions. Model objects can act as clickable points of interest and thus be linked to any sort of web-based information for the sake of contextualisation: textual, acoustic or graphic. There is a wide range of design options of 3D models. As in the case of classic maps, geometric shapes may be detailed or more generalised. Even more variable are the surface design options from photorealism to abstract and expressive non-photorealistic rendering solutions.


