Jan 30, 2021
What does 79° mean for the ice-mass loss in Greenland?

GNSS site BLAF at the northern side of Nioghalvfjerdsbræ
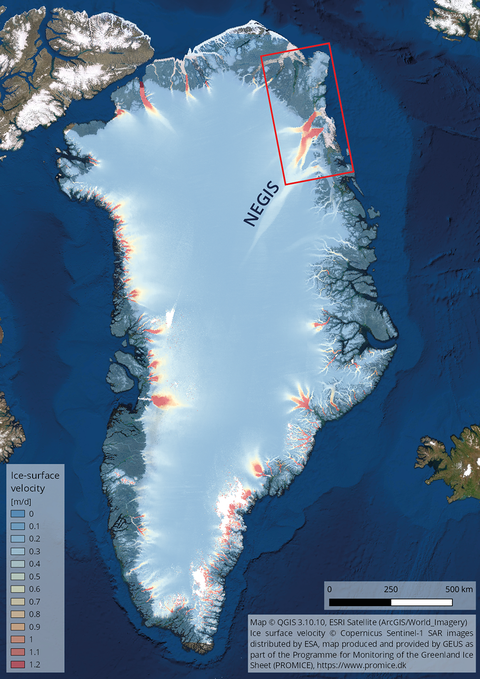
79° is not a temperature in Greenland, but a geographical designation: it refers to the Nioghalvfjerdsbræ (Danish for 79 Glacier), which is located at about 79° north latitude in north-east Greenland. Together with its southern neighbour Zachariae Isstrøm and Storstrømmen, which lies more than 100 km further south, this glacier is one of the three major outlet glaciers of the North East Greenland Ice Stream, or NEGIS. The Nioghalvfjerdsbræ forms a floating glacier tongue more than 75 km long and 22 to 32 km wide. The NEGIS itself can be traced over a distance of more than 700 km from the ice edge to the ice divide in the interior of the Greenland ice sheet, so it is of outstanding importance in the study of ice sheet dynamics and change.

Aerial view over the grounding zone of Nioghalvfjerdsbræ
A scientific article published on 28 January 2021 in the renowned Journal of Geophysical Research: Earth Surface deals precisely with this region in north-eastern Greenland. Maria Kappelsberger, other colleagues from the Geodetic Earth System Research group and S. A. Khan from the Danish Technical University (DTU Space, Copenhagen) have analysed satellite data and ground-based GNSS measurements.

Overview map of Greenland with ice-flow velocity
A central question that specialists worldwide are dealing with is: How is the ice mass of the Greenland ice sheet changing? Since the ice sheet has continental dimensions with 2500 km north-south extension and up to 1000 km east-west extension, satellite data must be used for this investigation. Previous studies have usually considered the methods of satellite gravimetry (measurement of the attraction effect of the changing masses) and satellite altimetry (measurement of the changing ice surface height) separately from each other. The study has now demonstrated that an evaluation combining the advantages of both methods leads to an improved estimate of Greenland's ice-mass balance. In addition to the actual ice sheet, the peripheral glaciers and ice caps were also included. We obtain an ice-mass change rate of (233 ± 43) Gt/a for the period 2010 – 2017 for Greenland as a whole. (233 Gigaton per year are 233 billion ton per year or 233 trillion kilogram per year and equals 233 cubic kilometre of water per year). Of the three major outflow glaciers of the NEGIS, Zachariae Isstrøm has the largest rate of (3.7 ± 1.3) Gt/a, while the rates for Nioghalvfjerdsbræ and Storstrømmen are each less than 0.5% of the total change.
But how can these figures be verified? To do this, we make use of the fact that the solid Earth is by no means to be regarded as a rigid body, but rather has elastic or viscoelastic properties that vary according to depth. These rheological properties, which depend on temperature and pressure, cause the Earth to deform under the influence of a variable mass loading. The deformation, which depends on the time course of the mass change, leads to changes in position, in particular to subsidence or uplift of the Earth's crust, which we can measure at fixed and specially marked points with geodetic GNSS technology. In the temporal course, a distinction must be made in particular between present-day ice mass changes – i.e. those that are to be determined with the aid of the aforementioned satellite methods – and past ice mass changes which date back to the last glacial maximum. Past ice mass changes yield the glacial-isostatic adjustment (GIA), i.e. a long-term response of the solid Earth. This ongoing adjustment process also affects a mass flow in the Earth's interior (in the so-called asthenosphere), the gravitational effect of which is also included in satellite gravimetry measurements and must therefore be corrected.

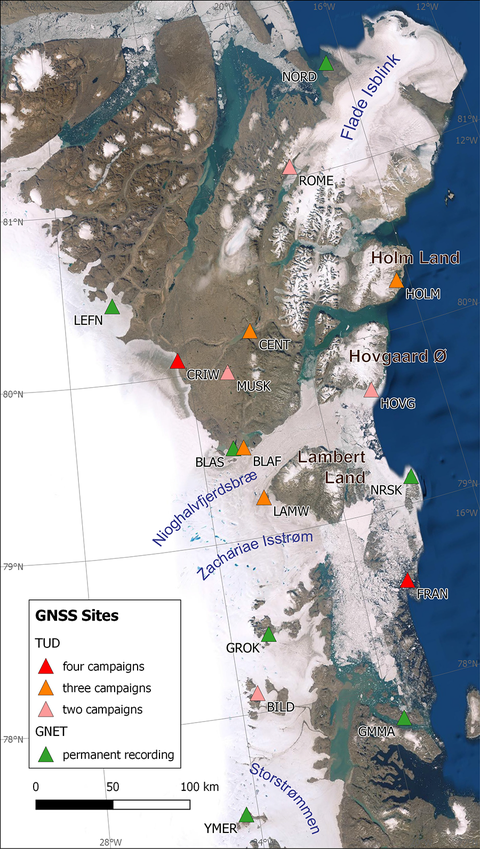
Overview map of north-east Greenland with GNSS sites
To determine the subsidence and uplift of the Earth's crust, we carried out five measurement campaigns in north-east Greenland between 2008 and 2017. We received great logistical support from the Alfred Wegener Institute Helmholtz Centre for Polar and Marine Research (AWI Bremerhaven). The repeatedly measured GNSS points are located in an area with a north-south extension of 350 km along the coast and up to 150 km inland at the edge of the inland ice. We have obtained vertical deformation rates of 4.5 mm/a and more for the period mentioned. Our "hotspot" is a measuring point on the west coast of Lambert Land, at the bifurcation of Nioghalvfjerdsbræ and Zachariae Isstrøm: Here we get the highest uplift rate of (8.9 ± 1.7) mm/a. Obviously, the recent mass changes have the strongest effect here, especially due to the immediate proximity to Zachariae Isstrøm. In addition, data from permanently recording GNSS stations of the GNET project were included so that the results obtained could be mutually validated. It was shown that the uplift rates are lower at points further away from the central working area (approx. 3 mm/a for YMER and approx. 4 mm/a for NORD).
Now it is possible to link the combined evaluation of satellite gravimetry and altimetry with GIA models. In addition to improved mass change rates, deformation rates are also obtained that represent the summary effect of long-term GIA and recent (elastic) deformation. We compared these modelled deformation rates with the rates we measured using GNSS. Our study shows that the GIA models used have large differences in the study area. By comparing with the in-situ measurements, we succeeded in narrowing down the range of GIA models "valid" in north-east Greenland. The GIA mass effect in north-east Greenland (in a suitably tailored basin) is almost 18% of the determined ice mass change. For Greenland as a whole, this effect is slightly more than 4%. This also proves that the GIA effect has a regionally different behaviour and not only must not be neglected, but that only its precise and reliable knowledge enables to reliably estimate the ice mass change on a regional scale.
With the publication in JGR: Earth Surface the results of our GNSS measurements are published for the first time. Also the results of the improved estimate of the ice-mass change rate are published, namely in PANGAEA, a relevant archiving portal for Earth-related data. Our study provides important insights into the interaction of ice-mass change and solid Earth in north-east Greenland. The new insights contribute to the interdisciplinary project "Greenland Ice Sheet Ocean Interaction" (GROCE), which investigates the processes between ocean, atmosphere, ice sheet and peripheral glaciers with a focus on north-east Greenland.

GNSS site HOVG with view to the front of Nioghalvfjerdsbræ
The next fieldwork is planned for the summer of 2021 - among other things, to visit the Zachariae Isstrøm hotspot and carry out repeated GNSS measurements on Lambert Land.
Further links:
- Paper: https://agupubs.onlinelibrary.wiley.com/doi/abs/10.1029/2020JF005860
- PANGAEA: https://doi.pangaea.de/10.1594/PANGAEA.922884
- Data portal for gravimetric mass balance of the Greenland ice sheet: https://data1.geo.tu-dresden.de/gis_gmb/
- Data portal for ice-flow velocity of Greenland outlet glaciers: https://data1.geo.tu-dresden.de/flow_velocity/
- BMBF research project GROCE: https://groce.de/en/
- GROCE sub-project 6: https://tu-dresden.de/bu/umwelt/geo/ipg/gef/forschung/groce
The research work within the GROCE project is funded by the Federal Ministry of Education and Research (BMBF) (FKz. 03F0778G and 03F0855C).

GNSS site ROME at the western side of Romer Sø
CONTACT
 © Sven Ellger
Senior Scientist
NameDr.-Ing. Mirko Scheinert
Send encrypted email via the SecureMail portal (for TUD external users only).
