Lehrangebot
Das Center Synergy of Systems (SynoSys) verbindet aktuelle Forschung mit innovativen Lehrmethoden, um Studierenden eine dynamische und interdisziplinäre Lernerfahrung zu bieten. Unsere forschungsnahen Lehrveranstaltungen behandeln zentrale Themen wie Data Visualization, komplexe Systeme und Computational Social Science.
Durch interaktive Seminare, projektbasiertes Lernen und kritische Diskussionen ermöglichen wir es Studierenden, sich aktiv in wissenschaftliche Prozesse einzubringen und essenzielle Fähigkeiten für die datengetriebene Forschung und Innovation zu entwickeln. Unser Lehrkonzept setzt auf praxisnahe Ansätze, den Austausch mit führenden Wissenschaftler:innen und die Anwendung von Erkenntnissen in realen Kontexten.
Hier finden Sie Informationen zu aktuellen Seminaren und Lehrveranstaltungen, Möglichkeiten zur Mitarbeit an Forschungsprojekten und Zugang zu Lehrmaterialien und Ressourcen.
Werden Sie Teil unserer Lehrangebote und entdecken Sie, wie akademische Forschung in der Praxis Anwendung findet – in einer sich stetig weiterentwickelnden digitalen Welt.
Inhaltsverzeichnis
Methods to Computational Social Sciences (CSS)
Dr. Philipp Lorenz-Spreen (Lecture)
Dr. Sami Nenno (Exercise)
| Time (Lecture) | Mondays, 3. DS |
| Location (Lecture | APB/E001 |
| Time (Exercise) | Mondays, 5. DS |
| Location (Exercise) | APB/E010 |
| Type/SWS | (2/2/0) |
| Modules | INF-BAS3 (Software- und Web-Engineering) |
| Language | English |
| Assessment | oral exam |
Description:
Social media generates new types of data for quantifying human behavior, but also raises interesting research questions about the interaction between technology and society. In this course, we will learn the basics of computational social science, with a focus on text-as-data, and apply its methods to real-world data science problems from social media and other sources.
The lecture will introduce you to social science research questions and findings, while the exercise will give you the practical skills to answer social questions yourself using computational tools. The first part focuses on basic techniques of text analysis. We will learn how to collect text data from sources such as newspapers, parliamentary minutes or social media, and how to pre-process it for natural language processing (NLP), such as sentiment analysis.
We will then move on to analyzing the structural factors of online data, from time series to networks and their dynamics. We will also explore how to collect such data from social media and how to conduct online field experiments. We will then have the tools to move on to applied research questions, covering topics such as political polarization, misinformation, public health and human mobility. We will learn what conclusions can and cannot be drawn from these descriptions. Finally, we will go beyond description and learn about causality, simulation models of social systems that allow mechanistic understanding.
The last part of the course will focus on NLP again, this time with a focus on deep learning methods such as Large Language Models (LLMs). We will use transformer models to identify complex patterns in the communication of German parties on social media.
In summary, this course will provide a toolbox for describing different types of social systems with a focus on textual data, as well as a family of modelling approaches that can go beyond individual-level statistics to describe collective processes.
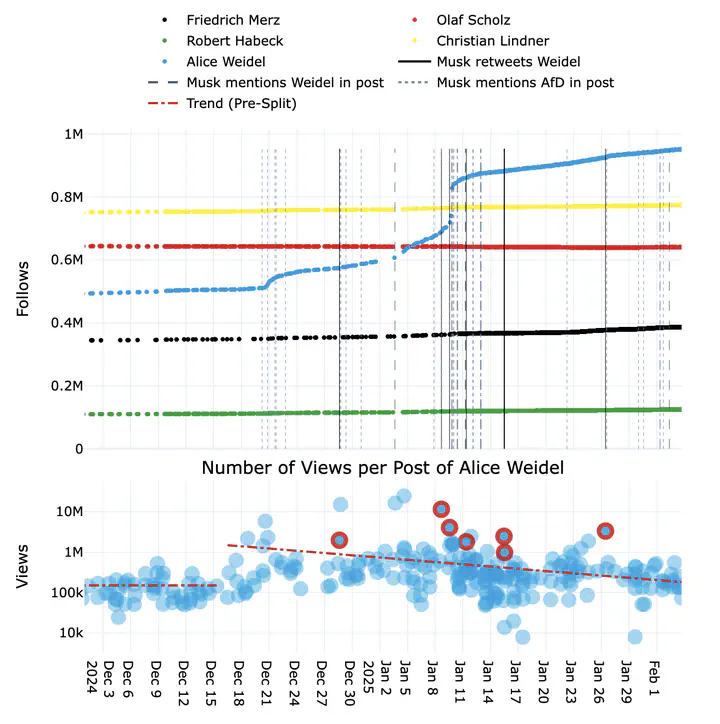
Latest work
Enrollment:
- Official enrollment (e.g., for exam): SELMA
- Communication and learning materials: OPAL
- Enrollment to both is open until 07-31-2025
Schedule:
| Week # | Date | Topic |
|---|---|---|
| Week 1 | What is Computational Social Science? | |
| Week 2 | Data, types, sources and preparation in R/Python | |
| Week 3 | Collecting text data | |
| Week 4 | Identifying sentiment and clusters | |
| Week 5 | Time series analysis | |
| Week 6 | Regressions and statistical modeling | |
| Week 7 | Network science 1 | |
| Week 8 | Network science 2 | |
| Week 9 | Causal inference in observational data | |
| Break | June 8 - 15 | |
| Week 10 | Agent-based-models | |
| Week 11 | Topic Modeling with Transformers 1 | |
| Week 12 | Topic Modeling with Transformers 2 | |
| Week 13 | LLMs | |
| Week 14 | Final session, feedback, Q&A, Discussion |
Bibliography:
Llaudet, E., & Imai, K. (2022). Data analysis for social science: A friendly and practical introduction. Princeton University Press.
Albert-László Barabási (2015). Network Science. Cambridge University Press (also here: networksciencebook.com)
Cunningham, S. (2021). Causal inference: The mixtape. Yale university press.
Lazer, D., Pentland, A., Adamic, L., Aral, S., Barabási, A. L., Brewer, D., ... & Van Alstyne, M. (2009). Computational social science. Science, 323(5915), 721-723.
Flache, A., Mäs, M., Feliciani, T., Chattoe-Brown, E., Deffuant, G., Huet, S., & Lorenz, J. (2017). Models of social influence: Towards the next frontiers. Jasss-The journal of artificial societies and social simulation, 20(4), 2.
Lorenz-Spreen, P., Oswald, L., Lewandowsky, S., & Hertwig, R. (2023). A systematic review of worldwide causal and correlational evidence on digital media and democracy. Nature human behaviour, 7(1), 74-101.
Introduction to Statistical Modeling for Online Behavior Data (Seminar)
Dr. Kamil Fuławka
| Time | Thursdays, 5. DS |
| Location | BAR/0I89 |
| Type/SWS | (0/0/2) |
| Modules | INF-BAS3 (Software- und Web-Engineering) |
| Language | English |
| Assessment | oral exam |
Description:
Online platforms generate vast amounts of behavioral data, including subjective ratings (e.g., likes, stars, reactions) and objective engagement metrics (e.g., views, clicks, watch time). While machine learning excels at predicting user behavior, statistical modeling—a cornerstone of empirical research—is critical for interpretable analysis. It helps uncover relationships between user behavior and various factors (e.g., how demographics influence engagement patterns) and enables causal inference in experiments (e.g., measuring the impact of different feed-ranking algorithms on user experience). These methods are widely used in UX research, product analytics, and A/B testing.
This course provides a hands-on introduction to statistical modeling in R, focusing on methods most useful for analyzing behavioral data. We'll cover key concepts and progress to model selection based on outcome type. Topics include logistic regression for binary outcomes (e.g., like/dislike reactions), ordinal regression for rating scales, beta regression for continuous feedback (e.g., sliders), and hierarchical models for nested data (e.g., multiple ratings from the same users). In the end, you'll not only know which model to use but also how to effectively visualize and communicate your findings through clear, interpretable result presentations.
No prior statistical modeling experience is required. If you're familiar with Python or similar languages, the transition to R should be easy. All scripts and exercises are provided.
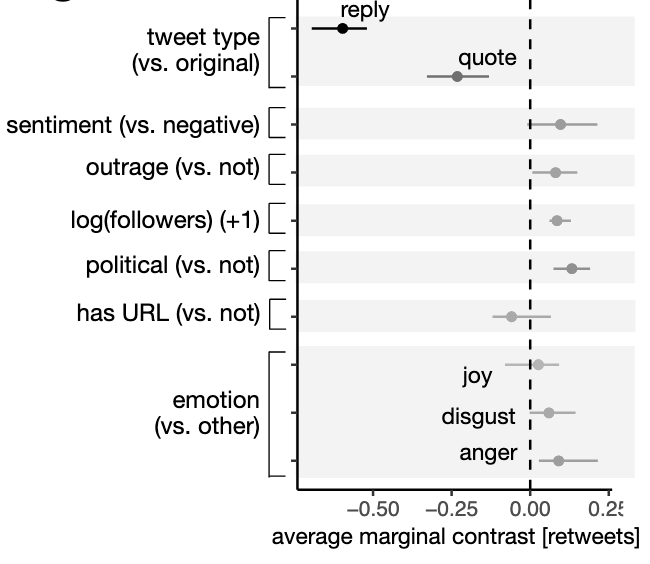
Predictors of sharing intentions
Enrollment:
- Official enrollment (e.g., for exam): Selma
- Communication and learning materials: OPAL
- Enrollment to both is open until 07-31-2025
Schedule:
Part 1: General Introduction
| Week # | Date | Topic |
|---|---|---|
| Week 1 | Introduction to statistical modeling: goals and principles | |
| Week 2 | Linear regression: the foundational model, applications and limitations |
Part 2: Selected Generalized Linear Models
| Week # | Date | Topic |
|---|---|---|
| Week 1 | Logistic regression 1: analysis of likes and dislikes | |
| Week 2 | Logistic regression 2: multivariate analysis | |
| Week 3 | Ordinal regression 1: stars and other likert-type ratings | |
| Week 4 | Ordinal regression 2: modeling distributional parameters | |
| Week 5 | Beta regression 1: slider-type ratings | |
| Week 6 | Beta regression 2: modeling distributional parameters | |
| Week 7 | Interim summary, additional exercises, and other GLMs |
Part 3: Experimental design & hierarchical models
| Week # | Date | Topic |
|---|---|---|
| Week 1 | Modeling between- and within-individual experimental designs | |
| Week 2 | Hierarchical models 1: introduction | |
| Week 3 | Hierarchical models 2: logistic and ordinal regression | |
| Week 4 | Hierarchical models 3: Beta regression | |
| Week 5 | Final session, Q&A, discussion and feedback |