Research Field of Visualization and visual Analysis
- Visual Analysis of large, dynamic data
- Interactive visual exploration in real time
- Visualization of large particle-based, multi- and high-dimensional data
- Applications from granular media, molecular dynamics, thermodynamics, hydrodynamics, physics, cellular biology, and systems biology
- Software engineering of interactive visualization systems
Contact: Dr. Sebastian Grottel
 © Ludwig Schmutzler
Mitarbeiter
NameDr. rer. nat. Sebastian Grottel
Send encrypted email via the SecureMail portal (for TUD external users only).
Professur für Computergraphik und Visualisierung
Professur für Computergraphik und Visualisierung
Visiting address:
Andreas-Pfitzmann-Bau, Raum 2108 Nöthnitzer Str. 46
01187 Dresden
Visualization of large time-dependent Data Sets
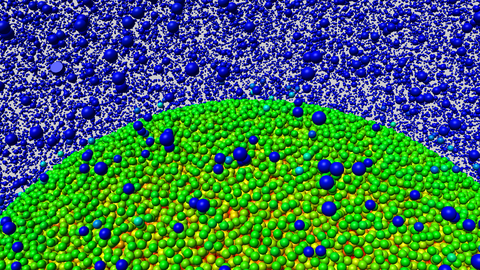
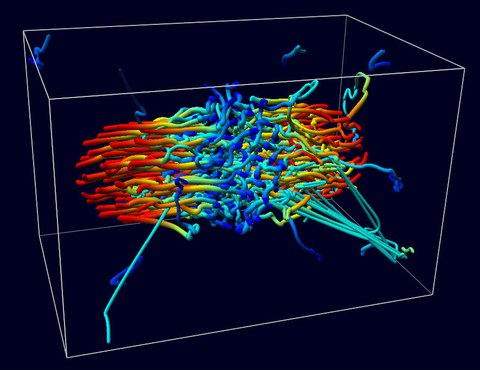
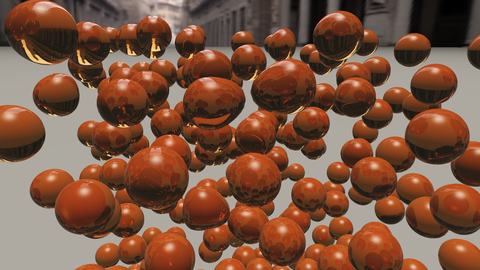
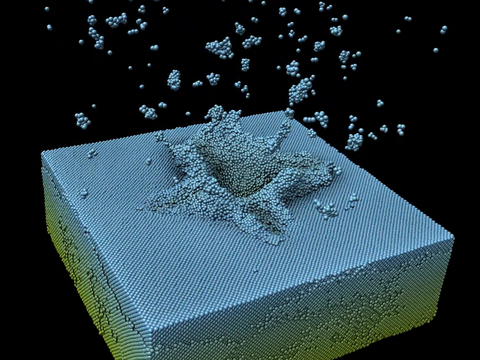
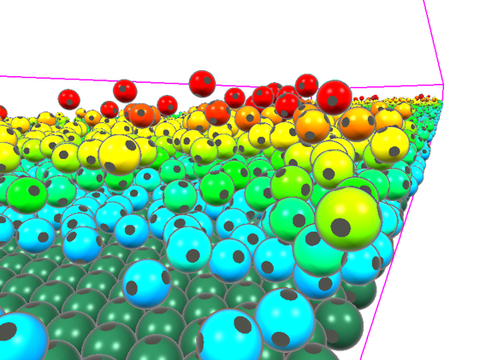
The Research focus in Visualization and visual Analysis is on the scientific visualization of large data. This includes the representation of such data, both for presentation and communication, as well as the visual exploration and analysis. Our work exemplary uses particle-base data sets from physics, thermodynamics, biology and life sciences. We use data sets of macroscopic particles from hydrodynamic simulations, like sediment transport in river beds or the behavior of bubbles in liquids. Other data sets result from atomistic or molecular simulations of materials, and also from development processes of cell cultures measured with three-dimensional microscopy. We create visualizations of such data in the classical post-process way, as well as in modern in-situ concepts.
We implement the interactive, visual exploration using modern methods in computer graphics and utilizing programmable graphics hardware. Intuitive handling and navigation within large data sets is as important as using a meaningful representation. In the focus of our work are corresponding data structures and algorithms, optimally utilizing the capabilities of modern GPUs. This is true for classical computer graphics techniques as well as GPGPU approaches. With the later we are active in the NVIDIA GPU Cluster of Excellence of the TU Dresden.
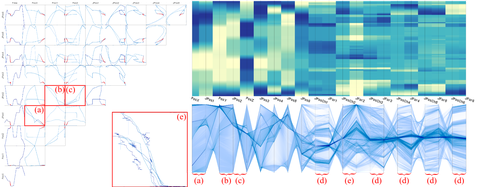
For example, within the ESF Junior Research Group VICCI we developed an interactive visual exploration of multi-dimensional time-dependent data utilizing different types of diagrams. The data was collected in real time from robots and CPS infra structure (smart home), and was visualized directly, without the need for further assumptions. The resulting visualization, based on coordinated views of continuous-time scatterplot matrices, continuous-time parallel coordinate plots and time-dependent heatmaps, enabled us to interactively view the multi-dimensional data in real time. It thus is a perfect option for a first visual analysis step.
In close collaboration with the University of Stuttgart, we are involved in the development of the visualization system software MegaMol™. MegaMol™ aims at interactive exploration of large particle-based data sets on common desktop computers. For this, MegaMol™ optimally utilizes modern graphics hardware and provides perfect opportunities for the development of research prototypes for scientific visualization. As results of the joint work of both universities this system was published in the major journal in the field of visualization.
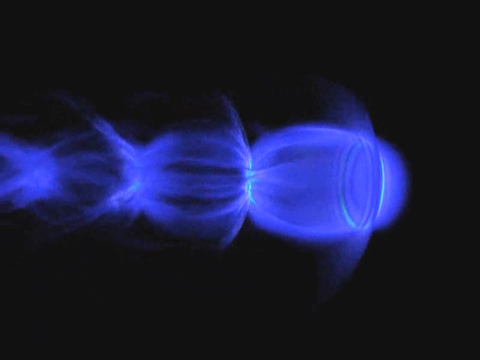
SOME Images of Results
Websites of Projects within this Research Field
- http://megamol.org – Visualization Framework MegaMol™
- https://ccoe-dresden.de – NVIDIA GPU Cluster of Excellence, Dresden
- http://www.vicci.eu – ESF Junior Research Group VICCI

