The SrV standard
Table of contents
Research subject
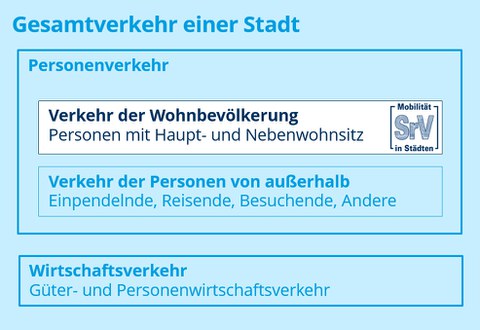
Since the population of the SrV study consists of the inhabitants of a city or municipality, the mobility of the residential population is the central research subject. It is assumed that the traffic generated by the residential population contributes significantly to the travel volume of a study area. Other relevant transport types such as, in particular, commuter, tourist, and visitor transport are not considered in the SrV. In terms of commercial transport, only passenger commercial transport is covered to a limited extent, if it occurs as a component of the resident traffic.
Survey characteristics
The survey collects structural characteristics of households and the persons living in them as well as behavioral personal data and travel data for a given reporting day. The SrV standard questionnaire covers a wide range of characteristics relevant to planning. Many clients take advantage of the possibility to adapt and expand the set of queried characteristics by means of special and additional questions. The complete question program of the last two SrV runs is documented in the methodology report 2018 and in the methodology report 2013 (both in Appendix II).
Survey design
The survey design is characterized by certain standard features to ensure a continuous and comparable time series:
|
Population |
Urban population |
| Question program |
Household, persons, trips |
| Definition of trips | Change of location with exactly one purpose, can include several means of transport |
| Main mode of transport |
Hierarchy of modes of transport |
| Sampling | Random sampling from the register of residents |
| Persons surveyed | Survey of all household members |
| Trips surveyed |
All trips on a randomly assigned reporting day |
| Reporting day | Central weekday (Tue, Wed, Thu excluding school breaks, public holidays and the days directly before or after them) |
| Reference time | Mean traffic of the year |
| Field time period | 12 months |
| Weighting | According to sociodemographic as well as spatial and temporal characteristics |
| Results | City specific, groups of participating cities, comparison of participating cities |
Sampling
The population consists of all residents of the respective SrV city. The municipal register of residents forms the basis for random sampling. There are no restrictions regarding age, nationality, main or secondary residence.
Ideally, the sample size is to be dimensioned taking into account the required accuracy. At the same time, it is limited by the available financial resources. The size of the sample is therefore always a compromise between the need for analysis and evaluation, accuracy and costs. For the SrV standard case, it is traditionally determinded based on trip frequency (specific travel volume) and the modal split at the citywide level. The determination of the SrV minimum sample in a larger city is based on the fact that 1,000 respondents are required to determine the specific travel volume for the entire city with a 95 percent certainty and an accuracy of ± 4 percent, and to survey the modal split (share of private motorized vehicles) with an accuracy of ± 2 percentage points, assuming unrestricted random selection. Higher accuracy requirements or subspatial differentiations within the urban area require higher samples. As a general rule, quadrupling the sample size is connected to doubling the statistical accuracy.
Transport relationships between subareas of the urban area can generally not be mapped with this data. However, the SrV data are suitable for use in transport models, which are usually used to calculate transport relationships.
Analysis
The evaluation of the collected data is standardized for each study area according to a catalog of parameters (analogous to the standard tables 1.1 to 11.3 in the SrV for large cities located in Eastern Germany). Continuously maintaining these parameters facilitates the retrieval of comparable figures from different years. At the same time, the evaluation is repeatedly reviewed and adapted to current requirements.
In addition, it is possible to have particular city-specific issues examined in more detail within the margins given by the respective sample.
Presentation of results
The results for each survey area always include the SrV fact sheet and the SrV table report as well as a field report. If subspatial evaluations were commissioned, additional fact sheets and table reports are delivered. In addition, the methodology report, the comparison of participating cities and the evaluation of the groups of the participating cities are a part of the results of the study.
Insights on the contents of the city-specific table reports and fact sheets can be found in the cross-city evaluations of the large cities located in Eastern Germany in the table report (standard tables 1.1 to11.3) as well as the fact sheet of the SrV 2018.

