lo2s
lo2s is a lightweight performance monitoring tool for Linux. It can sample and collect information from parallel application and full systems. In addition to instruction samples of the application, a wide range of metric data can be collected. This includes Linux perf counters, kernel tracepoints, model specific registers, and custom metric data provided by plugins (compatible with Score-P [http://www.vi-hps.org/projects/score-p/]. lo2s generates traces in the Open Trace Format 2 (OTF2) that can be visualized in Vampir.
lo2s works on unmodified applications - recompilation or relinking is not required.
It is easy to install on any Linux system and available as free software. An important focus is a predictable and tunable impact on the application to emphasize the performance characteristics of the observed application, not the measurement itself.
Publications
- Thomas Ilsche, Mario Bielert, Christian von Elm. "Bridging the Gap between Application Performance Analysis and System Monitoring" In: International Conference on Cluster Computing (CLUSTER), 2022. DOI: 10.1109/CLUSTER51413.2022.00080
- Thomas Illsche, Robert Schöne, Phillip Joram, Mario Bielert and Andreas Gocht: System Monitoring with lo2s: Power and Runtime Impact of C-State Transitions. In: Proceedings of the IEEE Workshop on High-Performance Power-Aware Computing (HPPAC). 2018. DOI: 10.1109/IPDPSW.2018.00114 [PDF]
- Thomas Ilsche, Robert Schöne, Mario Bielert, Andreas Gocht and Daniel Hackenberg: lo2s – Multi-Core System and Application Performance Analysis for Linux. In: Workshop on Monitoring and Analysis for High Performance Computing Systems Plus Applications (HPCMASPA). 2017. DOI: 10.1109/CLUSTER.2017.116 [PDF]
- Thomas Ilsche, Marcus Hähnel, Robert Schöne, Mario Bielert and Daniel Hackenberg: Powernightmares: The Challenge of Efficiently Using Sleep States on Multi-Core Systems. In: 5th Workshop on Runtime and Operating Systems for the Many-core Era (ROME). 2017. DOI: 10.1007/978-3-319-75178-8_50 [PDF]
Examples

Figure 1: Visualization of BT OpenMP
Figure 1: Vampir performance analysis of a BT benchmark on a dual-socket Intel Xeon E5-2690 v3 system. The visualization reveals activity during one main loop iteration (270 ms). Samples from different functions are color coded. The timeline also shows the power consumption during the different phases of one iteration. [1]

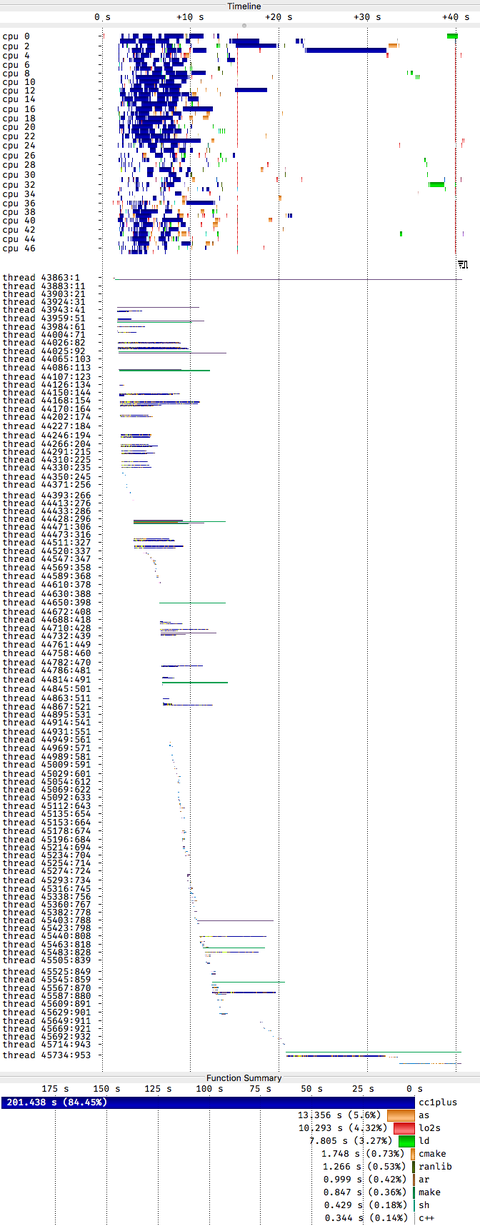
Figure 2: Visualization of parallel make with Vampir
Figure 2: Combined process and system monitoring of a parallel build using make -j. The top section shows the scheduled processes. The lifetime of processes and threads is shown in the second part. The bottom part denotes the cpu time of the involved processes. [1]

Figure 3: Visualization of Lustre kernel tasks with Vampir
Figure 3: Scheduling timeline of Lustre related kernel tasks during a short interval of time. This visualization allows for a detailed investigation of idle mispredictions and energy efficiency optimization. [2]
