I/O Analysis of BigData Frameworks
Goal: Analyze proprietary log data of Hadoop framework graphically
- Generation of HDFS performance logs with instrumented Hadoop framework
- Conversion of logs to OTF2 file format by means of Python
- The software Vampir presents I/O performance metrics like utilization or sent/received data over time
Programming frameworks in the BigData context such as Hadoop, Flink, or Spark have their own virtual, distributed file system infrastructure. In the context of BigData applications, this infrastructure is assumed as given and well performing. Often, little is known about how well the underlying I/O infrastructure is actually used and utilized. Existing tools for I/O performance evaluation such as Darshan show at best the system view. A mapping of the performance data to the context of the framework does not happen. Robert Schmidtke of the Zuse Institute Berlin (ZIB) investigates the I/O behavior of BigData analysis frameworks in his research work. This case study shows how large proprietary I/O performance data can be converted to the standardized OTF2 file format and graphically evaluated using the Vampir analysis tool.
Problem
Robert Schmidtke from the Zuse Institute Berlin (ZIB) studies the I/O performance of the Apache Hadoop Framework. For this purpose, he manually added performance probes (instrumentation) to the Hadoop Distributed File System (HDFS), which record a history of I/O events like read , write, and open. See Wrapper around HDFS and core Java I/O classes for collecting file statistics on GitHub. The resulting logs are proprietary and quickly become too large for manual inspection. The goal is to find a quick solution that enables visual data inspection. The Vampir performance visualizer has a long product history and is designed for the visual analysis of performance logs.
The application under test is the popular Hadoop MapReduce TeraGen/TeraSort benchmark. TeraGen generates the input data, which consists of 1 TiB of 10-byte key/90-byte value records. These records are stored in HDFS, randomly distributed over all worker nodes. During the Map step, TeraSort samples 100,000 keys to define ranges for each Reducer, which then sort the non-overlapping ranges into global ordering.
Approach
It turns out that properties of the recorded I/O performance data are very similar to data processed by the Vampir performance visualizer, which is known for its processing capabilities of large data volumes. A conversion of the data is considered to be the most practical solution to studying the data graphically with Vampir. The file format used by Vampir is called OTF2. Its definition and implementation is publicly available and open sourced. The reference implementation provides C and Python APIs. The latter will be used for this case study.
Implementation
The following description briefly covers the conversion of the proprietary I/O data to the OTF2 file format. Please contact Robert Schmidtke if you need information on how the data was originally collected from HDFS.
The converter was written during a two-day workshop at ZIH. The initial implementation needed less effort than a day and deploys the OTF2 support library and its Python bindings. The OTF2 sources can be downloaded from here. They need to be installed with the following commands:
| $ tar -xzf otf2-2.2.1.tar.gz |
|
$ ./configure --prefix="$HOME" |
| $ make install |
Please note that OTF2's python bindings require the python future package installed on your system.
Writing data to a new OTF2 formatted file with Python works as described in this example. Writing a trace file basically consists of the following four steps:
- Create new OTF2 file
- Define static properties like the system tree or objects that produce events
- Write timed events
- Finalize the OTF2 file
Please, check the resulting converter script for further details.
Once the data are converted to OTF2 file format the analysis and interpretation step can start. Data in OTF2 file format can be analyzed with different objectives by means of community tools as listed here. In this case study we focus on using Vampir for data analysis.
Results
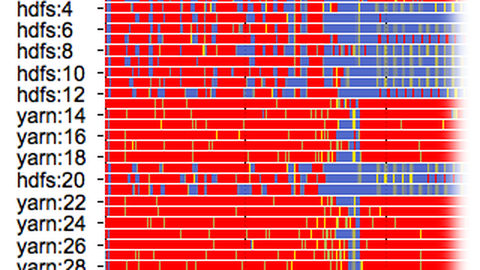
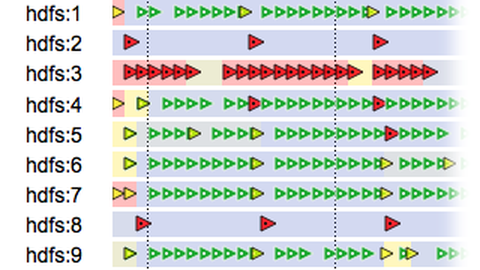
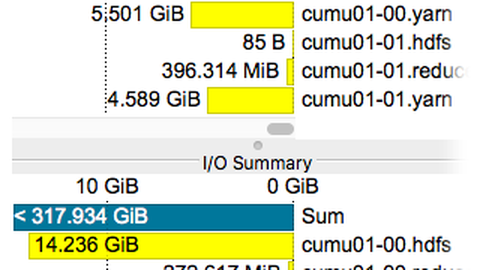
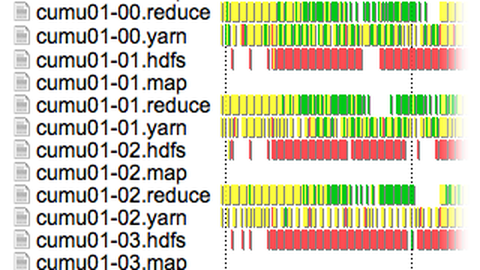
The proprietary HDFS I/O performance log has roughly 100,000 timed entries originating from 64 file system components. The I/O events in the log have been successfully converted to an OTF2 compliant trace file by means of a small translation script written in Python. The Vampir performance tool translates this trace file into interactive graphical charts as depicted below.

Charts for I/O Analysis taken from the Vampir software
The timed read and write events of HDFS are depicted in the timelines to the left. Corresponding aggregated performance metrics are depicted in the tables on the right. There is a clear difference between read and write operations. Overall, data are written three times more frequently than read (1.4 TiB vs. 470 GiB). The read and write patterns to the left indicated when the respective file system components are performing read and write operations. At this stage the initial goal is achieved. The given internal HDFS I/O performance data can be studied graphically.
Observing a large amount of written data during the first phase suggests a lot of unexpected and unnecessary spilling. Using the insights obtained from above I/O statistics we were able to reduce the amount of I/O by 40% to 50% by means of better buffer configurations, as well as identify a bug in Yarn’s shuffle algorithm. For a full interpretation of the patterns and aggregated numbers please contact Robert Schmidtke.
Contact
- Vampir performance visualization, coordination
Dr. Holger Brunst, ZIH - OTF2 file format python API and data conversion
Sebastian Oeste, ZIH - HDFS instrumentation, measurement, and data conversion
Robert Schmidtke, ZIB


