Perf - System and Application Tracing on Linux
[short link to this page: http://tu-dresden.de/zih/perf/]
There is a variety of tools to measure the performance of Linux systems and the applications running on them. However, the resulting performance data is often presented in plain text format or with only a very basic user interface. For large systems with many cores and concurrent threads, it is increasingly difficult to present the data in a clear way for analysis. Moreover, certain performance analysis and debugging tasks require the use of a high-resolution time-line based approach, again entailing data visualization challenges.
Tools in the area of High Performance Computing (HPC) have long been able to scale to hundreds or thousands of parallel threads in order to help finding performance anomalies. We therefore present a solution to gather performance data using existing Linux performance monitoring interfaces. A combination of sampling and careful instrumentation using either perf or ftrace allows us to obtain detailed performance traces with manageable overhead. We then convert the resulting output to the Open Trace Format (OTF) to bridge the gap between the recording infrastructure and HPC analysis tools. We explore ways to visualize the data by using the graphical tool Vampir. The combination of established Linux and HPC tools allows us to create an interface for easy navigation through time-ordered performance data grouped by thread or CPU and to help users find opportunities for performance optimizations.
Recently, we combined these techniques in a comprehensive and efficient tool:
https://tu-dresden.de/zih/forschung/projekte/lo2s?set_language=en
Contact
Download
Perf trace tools version 0.1-rc3
Publications
- Thomas Ilsche, Robert Schöne, Mario Bielert, Andreas Gocht and Daniel Hackenberg. "lo2s – Multi-Core System and Application Performance Analysis for Linux" In: Workshop on Monitoring and Analysis for High Performance Computing Systems Plus Applications (HPCMASPA). 2017. DOI: 10.1109/CLUSTER.2017.116
- Robert Schöne, Joseph Schuchart, Thomas Ilsche and Daniel Hackenberg. Scalable Tools for Non-Intrusive Performance Debugging of Parallel Linux Workloads in: Proceedings of the Linux Symposium, 2014
- Thomas Ilsche, Joseph Schuchart, Robert Schöne, and Daniel Hackenberg. Combining Instrumentation and Sampling for Trace-based Application Performance Analysis. In: Tools for High Performance Computing 2014. Springer International Publishing, 2014, The final publication is available at Springer via http://dx.doi.org/10.1007/978-3-319-16012-2_6
Examples
Perf2otf
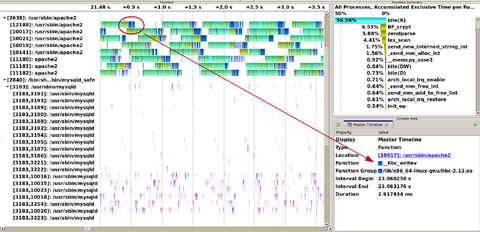
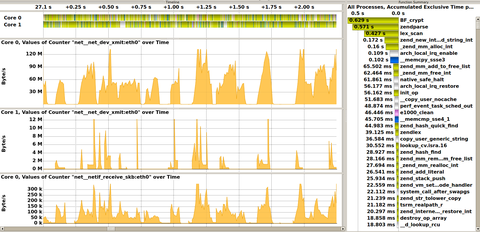
In this example we used perf to analyze a virtual machine running a private ownCloud installation using the Apache2 webserver and a MySQL database. The recorded workload consisted of six WebDAV clients, each downloading 135 image files with a total size of 500 MB per client.
Vampir visualization of a trace recorded with perf. Some processes were filtered and zoomed-in section is used to display some of the requests processed. This process-centric view shows the Apache processes (top) together with the MySQL threads for async I/O (middle) and for query processing (bottom). The top right display shows the function summary display which reflects the oversubscription of the two CPUs available to the virtual machine through the high portion of idle(R) state of the processes. Processes in this state are waiting for resources, e.g., a CPU time slice. Second to that, most time is spent on the processing of PHP scripts in the Apache server processes. The context view in the lower right appears when clicking on any of the functions in the function timeline, in this case the libc function __libc_writev used to send the data to the clients at the end of each processed request.
Visualization of a CPU-centric trace of the system. The timeline display on the top shows the activities on the two CPUs. Below are three counter timelines displaying the processing of outgoing (xmit) and incoming (receive_skb) packets. The majority of packet processing is performed on core 0, only a fraction of outgoing packets are processed on core 1 (middle display). The function display on the right side again reflects the majority of CPU time being spent on PHP processing (idle(R) states are only displayed for processes).
ftrace2otf
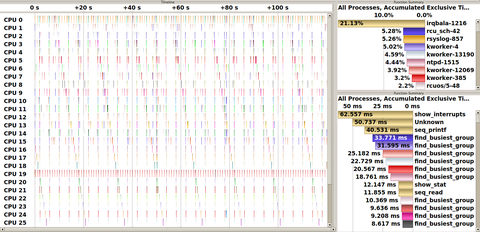
In this example we investigated the kernel activity of an idling dual socket Sandy Bridge system using the Linux function tracer ftrace. We show which components are still active and how much they contribute to the remaining system load.
Overview of the kernel activity during 120s on the idle system. The trace visualization shows some regular patterns: regular vertical lines every 4 seconds are watchdog threads; transversal lines every 16 seconds represent kworker and ondemand frequency governor activity. The profile on the right side shows which tasks (top) and functions (bottom) contribute are active during the recording.
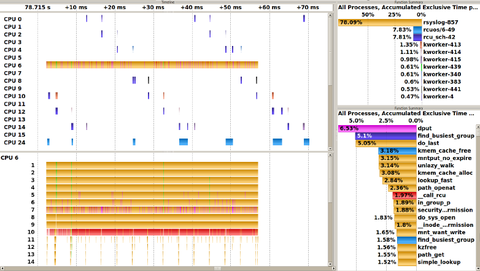
A section of the trace zoomed into the rsyslogd activity (colored light yellow), which triggers the RCU scheduler. rsyslogd calls to RCU objects are colored red. The rsyslogd daemon runs on CPU 6. The light blue activity represents the rcuos/6 task that offloads RCU callbacks for CPU 6 and runs on CPU 24. The remaining cores (16 to 31) are not visible in the screenshot since they do not show any activity in this time period. The CPU locations of the RCU scheduler and other kernel threads change over time across unoccupied cores of the same NUMA node that is also used by rsyslogd and rcuos/6.
See also
The Score-P instrumentation and measurement infrastructure is commonly used to instrument and record trace in the HPC ecosystem. The traces are commonly visualized using Vampir.


